Fig. 4
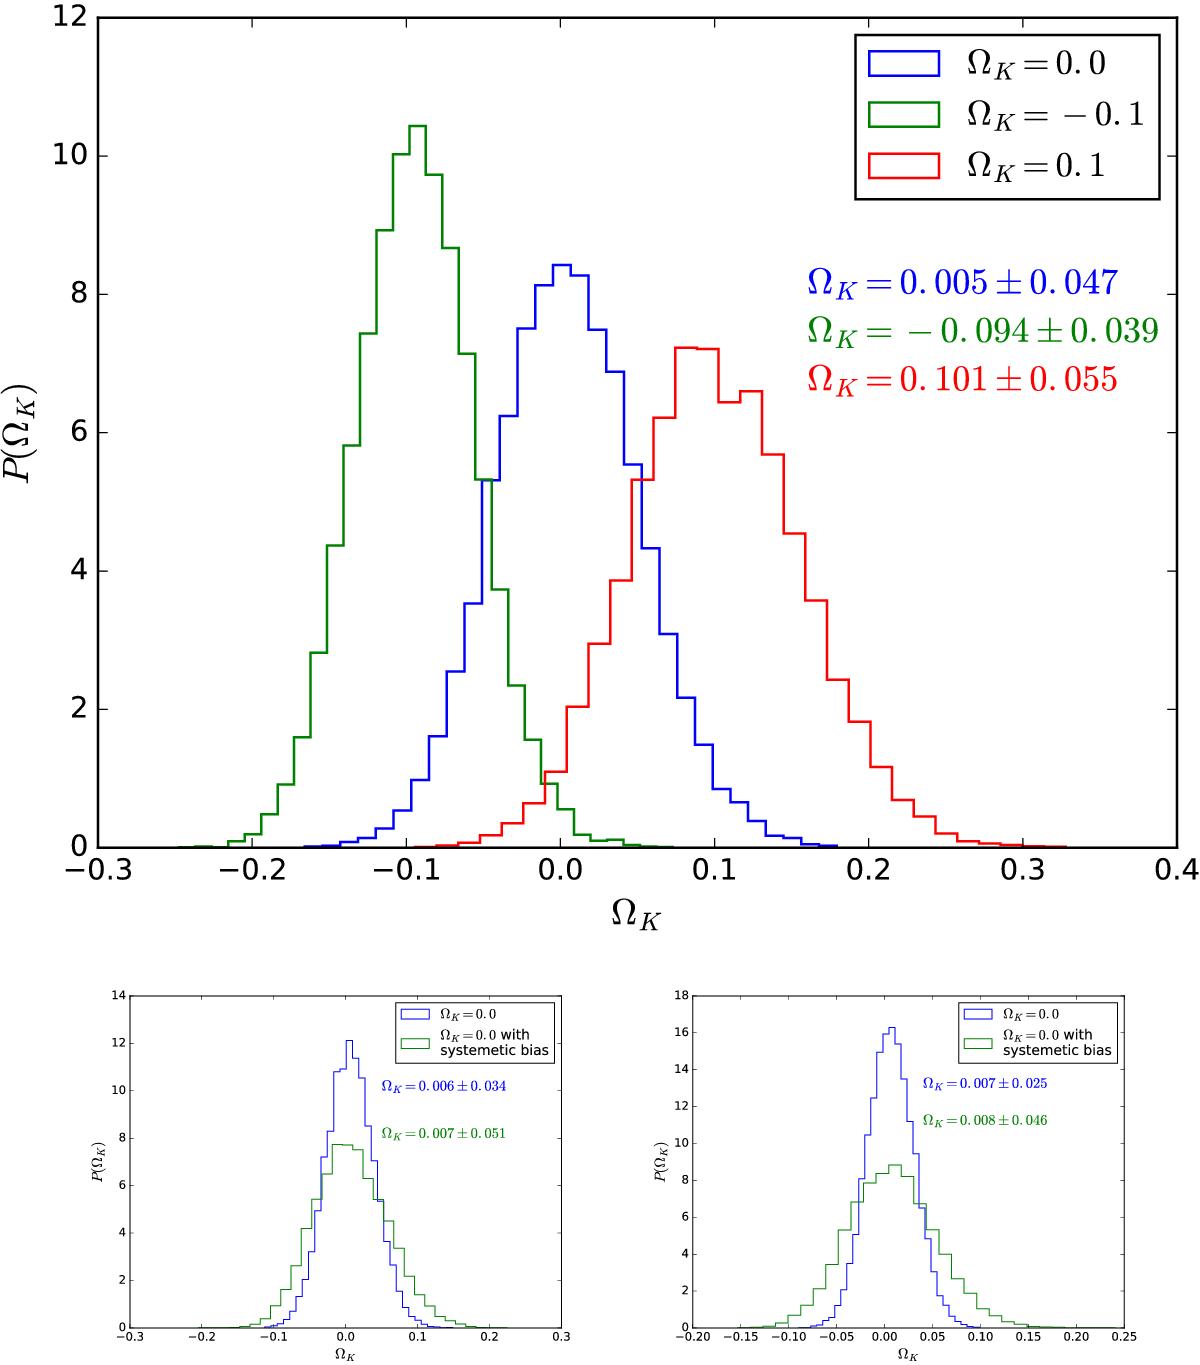
Top panel: posterior distributions of ΩK in three different ΩK cases with 500 mock FRBs data. The derived ΩK value are clearly well consistent with the assumed values. The bottom two panels show the ability of our method when the sample includes 1000 and 2000 FRBs. The blue and green histograms show the results without and with the systematic uncertainty, respectively.
Current usage metrics show cumulative count of Article Views (full-text article views including HTML views, PDF and ePub downloads, according to the available data) and Abstracts Views on Vision4Press platform.
Data correspond to usage on the plateform after 2015. The current usage metrics is available 48-96 hours after online publication and is updated daily on week days.
Initial download of the metrics may take a while.