Fig. 1
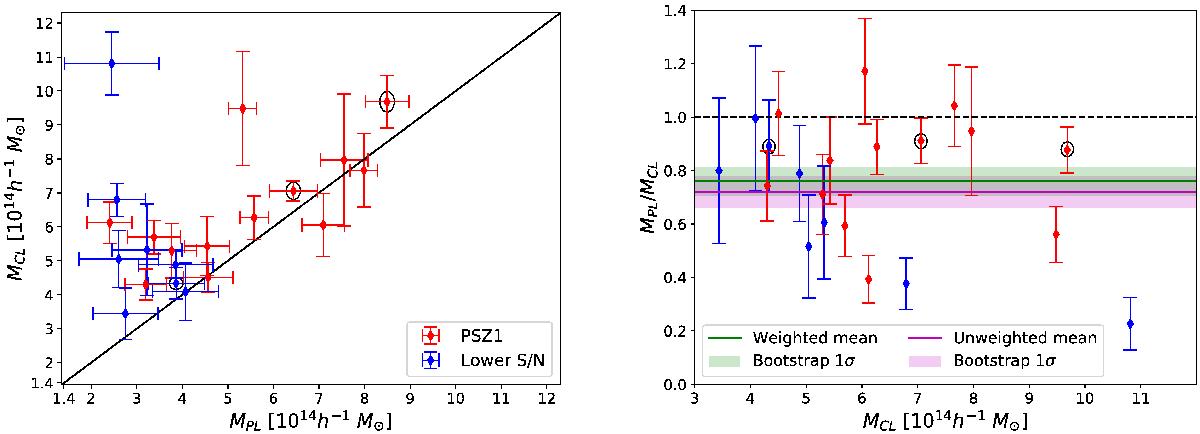
Mass comparison and mass bias estimates. On the left, we plot the CLASH lensing masses as a function of the Planck SZ mass proxy. Red points represent clusters found in the PSZ1 (13 objects) and blue those of the remaining objects at lower signal-to-noise (eight clusters); open circles identify the three clusters in the high-magnification subsample. The solid line is the equality line. The strongest outlier in the upper left corner is CLJ1226 at z = 0.89, the highest redshift object in the sample. The right-hand panel plots ρ = MPL/MCL as a function of CLASH mass together with its uncertainty Δρ (see text) in the same color scheme. The green line and band correspond to the sample mean, ⟨ ρ ⟩ s, and its standard deviation obtained from a bootstrap analysis: E( ⟨ ρ ⟩ s) = 0.72 ± 0.059, where E indicates a calculation over the bootstrap and ⟨ ρ ⟩ s is calculated as the inverse-variance weighted mean. Similarly, the magenta line and band represent the bootstrap mean and uncertainty of the unweighted mean: E( ⟨ ρ ⟩ s) = 0.76 ± 0.052. The dashed line indicates zero mass bias.
Current usage metrics show cumulative count of Article Views (full-text article views including HTML views, PDF and ePub downloads, according to the available data) and Abstracts Views on Vision4Press platform.
Data correspond to usage on the plateform after 2015. The current usage metrics is available 48-96 hours after online publication and is updated daily on week days.
Initial download of the metrics may take a while.