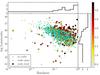
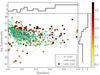
Fig. 3

Hardness-luminosity diagram for AGN. The coloured circles correspond to sources with constrained radio flux measurements, the colour denoting the relative radio loudness of the source. Radio-quiet sources, which have been detected only with an upper limit are shown by cyan triangles. The smaller green crosses correspond to sources with no available radio flux measurement. The side histograms show an average value of the relative radio-loudness in respective bins either in hardness (top) or luminosity (right). The histograms are calculated using only sources with constrained radio flux measurements. The plot is shown in logarithmic scale of hardness (left) for better comparison with XRBs and in linear scale (right) to show the hard-state part of the diagram in greater detail.
Current usage metrics show cumulative count of Article Views (full-text article views including HTML views, PDF and ePub downloads, according to the available data) and Abstracts Views on Vision4Press platform.
Data correspond to usage on the plateform after 2015. The current usage metrics is available 48-96 hours after online publication and is updated daily on week days.
Initial download of the metrics may take a while.