Fig. 2
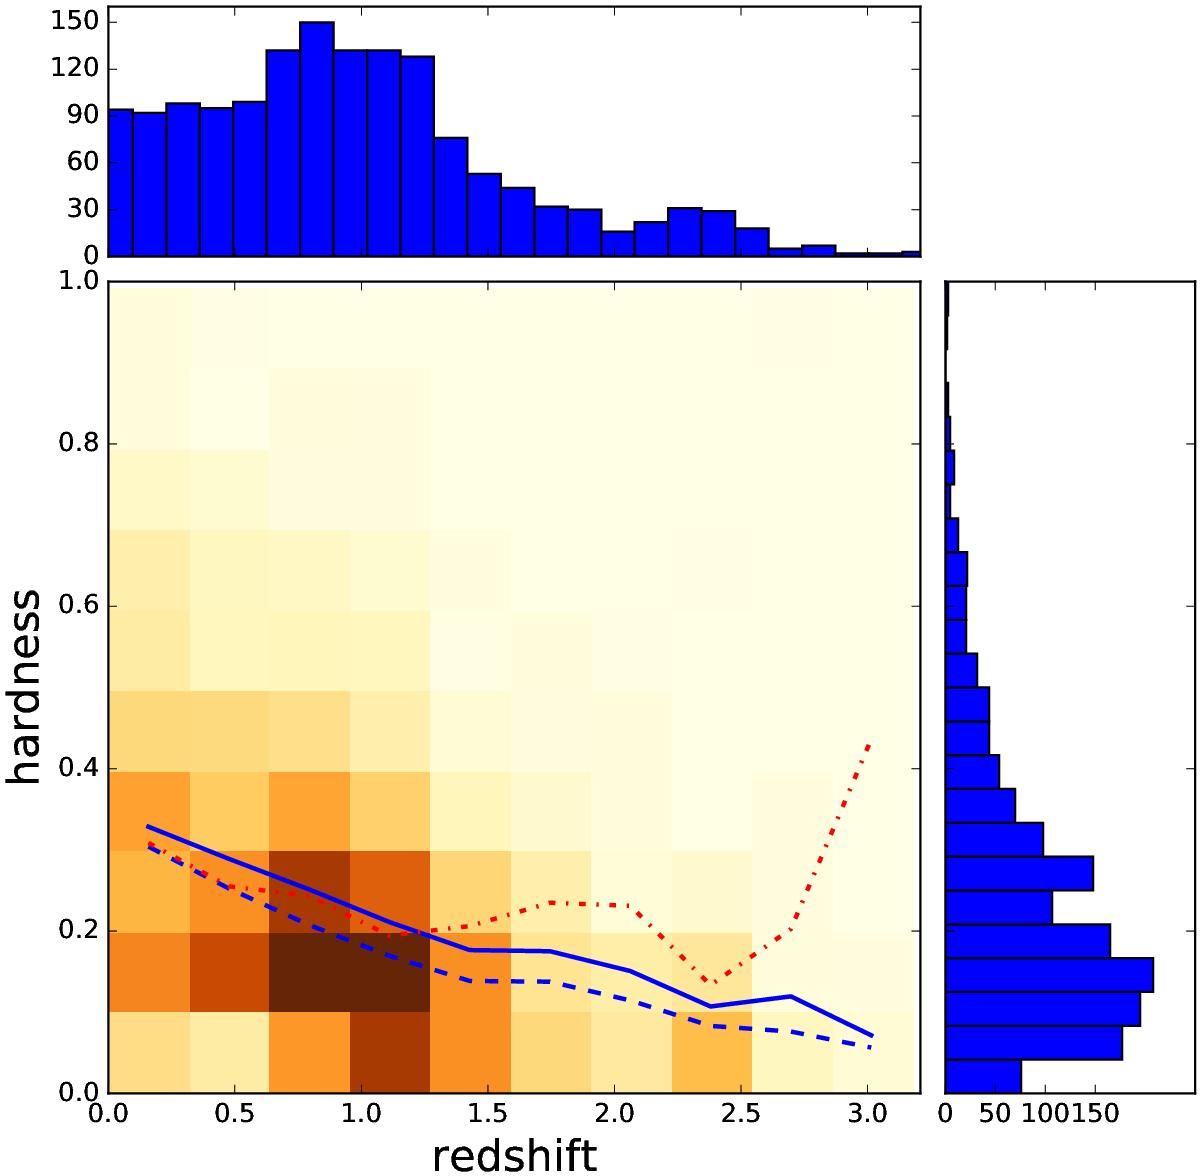
Redshift-hardness distribution of the main sample. The coloured 2D histogram shows the number of sources in a particular bin of redshift and hardness interval. The inserted curves indicate the mean value (blue solid line), median value (blue dashed line), and the ratio of the median to mode (red dot-dashed line) of the hardness per redshift bin. The side-bar histograms show the total number of sources per hardness and redshift bins, respectively.
Current usage metrics show cumulative count of Article Views (full-text article views including HTML views, PDF and ePub downloads, according to the available data) and Abstracts Views on Vision4Press platform.
Data correspond to usage on the plateform after 2015. The current usage metrics is available 48-96 hours after online publication and is updated daily on week days.
Initial download of the metrics may take a while.