| Issue |
A&A
Volume 602, June 2017
|
|
|---|---|---|
| Article Number | A119 | |
| Number of page(s) | 13 | |
| Section | Extragalactic astronomy | |
| DOI | https://doi.org/10.1051/0004-6361/201730434 | |
| Published online | 26 June 2017 | |
The M 101 group complex: new dwarf galaxy candidates and spatial structure
1 Departement PhysikUniversität Basel, Klingelbergstr. 82, 4056 Basel, Switzerland
e-mail:
This email address is being protected from spambots. You need JavaScript enabled to view it.
;
This email address is being protected from spambots. You need JavaScript enabled to view it.
;
This email address is being protected from spambots. You need JavaScript enabled to view it.
2 Research School of Astronomy and Astrophysics, Australian National University, Canberra, ACT 2611, Australia
e-mail: This email address is being protected from spambots. You need JavaScript enabled to view it.
Received: 13 January 2017
Accepted: 22 February 2017
Abstract
Context. The fine details of the large-scale structure in the local Universe provide important empirical benchmarks for testing cosmological models of structure formation. Dwarf galaxies are key object for such studies.
Aims. Our aim was to enlarge the sample of known dwarf galaxies in the local Universe. We performed a search for faint unresolved low-surface-brightness dwarf galaxies in the M 101 group complex, including the region around the major spiral galaxies M 101, M 51, and M 63 lying at a distance of 7.0, 8.6, and 9.0 Mpc, respectively. The new dwarf galaxy sample can be used in a first step to test for significant substructure in the 2D distribution and in a second step to study the spatial distribution of the galaxy complex.
Methods. Using filtering algorithms we surveyed 330 square degrees of imaging data obtained from the Sloan Digital Sky Survey. The images were visually inspected. The spatial distribution of known galaxies and candidates was analyzed and the system transformed into a M 101 eigenframe using the geometrical alignment of the group.
Results. We discovered 15 new dwarf galaxies and carried out surface photometry in the g and r bands. The similarity of the photometric properties of these dwarfs to those of Local Group dwarfs suggest membership to the M 101 group complex. The sky distribution of the candidates follows the thin planar structure outlined by the known members of the three subgroups. The ~3 Mpc long filamentary structure has a rms thickness of 67 kpc. The planar structure of the embedded M 101 subgroup is even thinner, with rms = 46 kpc. The formation of this structure might be due to the expansion of the bordering Local Void. Other implications are discussed as well.
Conclusions. We show the viability of SDSS data to extend the sample of dwarfs in the local Universe and test cosmological models on small scales.
Key words: galaxies: dwarf / galaxies: groups: individual: M 101 group / galaxies: photometry / large-scale structure of Universe
© ESO, 2017
1. Introduction
Searching the night sky for new stellar systems of ever lower luminosity and surface brightness, with the aim of enlarging the census of known galaxies in the Local Volume (LV, D ≤ 10 Mpc, Karachentsev et al. 2013), is a permanent and important task of extragalactic astronomy. Aside from an assessment of the faint-end slope of the galaxy luminosity function (e.g., Trentham & Tully 2002), which is a key observation for models of galaxy formation and evolution, it is above all the study of the “fine structure of large-scale structure” (Binggeli 1989), i.e., the 3D distribution of low-mass galaxies on large scales, that is fed and fostered by the detection of new nearby dwarf galaxies. Low-mass galaxies are expected to trace the distribution of non-baryonic dark matter (DM) on scales from kpc to Mpc, thus serving as a major test bed for models of structure formation. This is highlighted by the recent discovery of surprisingly thin planes of dwarf satellites in the Local Group (LG), around the Milky Way and the Andromeda galaxy (Pawlowski et al. 2012, 2013; Ibata et al. 2013). The significance of these structures in the context of Λ cold dark matter (ΛCDM) or alternative cosmological models is hotly debated (cf. Kroupa 2012; Pawlowski et al. 2015 and Libeskind et al. 2014; Cautun et al. 2015). But what is not debated is the urgent need to test other nearby groups of galaxies for the existence of similar features as the ubiquity of the phenomenon would be a challenge to the standard ΛCDM scenario of structure formation.
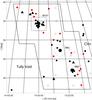 |
Fig. 1 Survey area of ≈330 square degrees in the M 101 group region. The black triangles are confirmed dwarf galaxies with distances in the M 101 group complex. The small black dots are members based on their photometric properties, compiled from the Local Volume Catalog (Karachentsev et al. 2004, 2013). The large black dots are the major galaxies that define the three subgroup centers in the region: M 101 (14h03m12.5s + 54d20m56s), M 51 (13h29m52.7s + 47d11m43s), and M 63 (13h15m49.3s +42d01m45s). The red dots indicate the positions of our 15 new dwarf candidates. Open circles are confirmed foreground (<5 Mpc) galaxies taken from the LV Catalog. The footprint of the Dragonfly survey around M 101 is outlined by the rectangle. The circles indicate the virial radii of ≈260 kpc (for M 101; Merritt et al. 2014) for the three major galaxies (assuming the same virial radius for M 51 and M 63 as for M 101). |
The well-known groups of galaxies in the LV (e.g., the Local Group, M 81 Group, Cen A/M 83 Group, IC 342/Maffei Group, Sculptor filament, and Canes Venatici cloud) have been, and are being, searched for new dwarfs to various surface brightness depths. Three surveys were recently conducted in the southern hemisphere in the directions of the loose Sculptor filament and the rich Centaurus group. There is the very deep but spatially limited (15 deg2) PISCeS survey (Sand et al. 2014; Crnojević et al. 2014, 2016); the Dark Energy Survey Camera (DECam) based SCABS survey (21 deg2) in five photometric bands ugriz (Taylor et al. 2016, 2017); and our own 550 deg2 DECam large-field survey (Müller et al. 2015, 2017), resulting in the discovery of dozens of new dwarf galaxies. One of our candidates, dw1335-29, has already been confirmed using the TRGB method (Carrillo et al. 2017), and more data is to follow (Müller et al., in prep.). Tully et al. (2015) reported two almost parallel satellite planes in the Centaurus A group. However, with the detection of multiple new dwarf galaxies around Cen A, this bimodal structure is now called into question (Müller et al. 2016). In the northern hemisphere, dedicated deep searches, resulting in the detection of numerous new dwarfs down to a completeness limit of MR ≈ − 10, were carried out in the rich M 81 group by Chiboucas et al. (2009, 2013). The authors noted that the satellites lie in a flattened (though not planar) distribution. In the M 101 group, which is the focus of the present study, the Dragonfly telescope (Merritt et al. 2014) and an amateur collective (Javanmardi et al. 2016) detected eight new dwarf candidates. Both surveys were confined to the immediate vicinity of M 101 (9 deg2), leaving out a large portion of the M 101 group complex that includes M 51 and M 63 (see below). A recent HST follow-up of the seven Dragonfly dwarf candidates has revealed that four candidates (M 101-DF4-7) are in fact ultra-diffuse galaxies most likely associated with a background group containing the ellipticals NGC 5485 and NGC 5473 at a distance of ~27 Mpc (Merritt et al. 2016).
Surprisingly, two of the three new faint Dragonfly dwarf members of the M 101 group (Danieli et al. 2017) are also visible on images of the shallower Sloan Digital Sky Survey (SDSS)1. Equally surprising, with few exceptions (Kniazev et al. 2004), the SDSS has not been employed for systematic searches for unresolved low-surface-brightness (LSB) dwarf galaxies over a large sky area. We therefore decided to hunt for new dwarfs in a large SDSS region of 330 square degrees covering not only the M 101 group, but the smaller neighboring groups around M 51 and M 63 as well, which seem to be connected to the former in a filamentary structure (see Fig. 3 in Courtois et al. 2013, also Fig. 1 below), a structure that we tentatively call here the M 101 group complex.
The M 101 group is more distant at 6.95 Mpc (Nataf 2015; Karachentsev et al. 2013) when compared to the rich M 81 and Centaurus A groups (at 4–5 Mpc), and it is completely dominated by the bulgeless spiral galaxy M 101. The group is known for its lack of low-mass galaxies and is possibly the poorest group in the LV (Bremnes et al. 1999). Eleven of the 14 confirmed members of the M 101 group complex are late-type spirals and dwarf irregular (dIrr) galaxies: KK 191, NGC 5023, DDO 182, Holm IV, NGC 5474, NGC 5477, KKH 87, DDO 194 (Karachentsev et al. 2013); NGC 5195 (Tonry et al. 2001); DF1 (Danieli et al. 2017); and NGC 5585 (Karachentsev et al. 1994). Only one is an early-type dwarf elliptical (dE) (UGC 08882; Rekola et al. 2005), and two are dwarf spheoridal (dSph) galaxies (DF2, DF3; Danieli et al. 2017). This stands in direct contrast to rich groups and clusters where early-type dwarf galaxies are the most abundant type of galaxies (Binggeli et al. 1987). The neighboring and environmentally related spiral galaxies M 51 (8.6 Mpc; McQuinn et al. 2016) and M 63 (9 Mpc; Jacobs et al. 2009) with their entourage are slightly farther away. It has been debated whether M 51 and M 63 plus satellites should be counted as members of the M 101 group. Tikhonov et al. (2015) argue against this view. In the present work, based on our analysis of the galaxy distribution in the region, we use the term “M 101 group complex” for all three galaxies and their satellites and the term “subgroup” for an individual host and its satellite population (M 101 subgroup, M 51 subgroup, and M 63 subgroup).
In the first part of the paper (Sects. 2–4) we present our search for new low-surface-brightness dwarfs in the region of the M 101 group complex with publicly available SDSS data. We report the discovery of 15 dwarf candidates and perform standard r and g surface photometry for them. As shown in Sect. 6.1, the photometric parameters of most candidates do suggest galaxy membership in the complex. In the second part of the paper (Sects. 5, 6.2) we study the structure of the M 101 group complex by introducing a suitable reference frame (Sect. 5). By a cosmic coincidence, it happens that the best-fitting plane through the M 101 subgroup members with known distances is seen almost edge-on with respect to our line of sight (LoS, similar to the Centaurus group, Müller et al. 2016). This allows a first assessment of where the new candidates lie in the complex without distance information. The filamentary or planar structure of the M 101 group complex is critically discussed in Sect. 6.2, followed by a general conclusion in Sect. 7.
2. SDSS Data
The Sloan Digital Sky Survey (Gunn et al. 2006) contributed a tremendous amount to the knowledge of the dwarf galaxy population in the Local Group. Numerous resolved dwarfs were discovered by several teams (e.g., Belokurov et al. 2010; Kim et al. 2015), pushing the limits of the known dwarfs into the regime of ultra-faint dwarf galaxies (MV> − 4 mag). There is currently no instrument that would enable us to discover such extremely faint galaxies outside of the LG. The typical limiting total luminosity reached beyond the LG is MV ~ − 9.5 mag, several magnitudes brighter than the LG ultra-faints. At the distance of M 101, with SDSS data we can reach an absolute magnitude of MV ~ − 10.
Taking the LG Sculptor dwarf galaxy as a typical dwarf spheroidal galaxy (at the faint end of the dE luminosity function), we can assume MI = − 4.1 mag and V − I = 1.5 mag for the tip magnitude and color of the red giant branch (TRGB) (Rizzi et al. 2007). This translates into Mr ≈ − 2.8 mag with V − r ≈ 0.2 mag. Assuming a distance of 7 Mpc for the dwarfs in the M 101 group we calculate an apparent TRGB magnitude of mr = 26.3 mag. The limiting magnitudes for point sources are provided by the SDSS Collaboration and are g = 23.3 mag and r = 23.1 mag, respectively (York et al. 2000). Thus, it becomes clear that in the SDSS data the TRGB is not resolved for dwarf galaxies in the M 101 group and group complex.
For our search of unresolved dwarf galaxies we used 323 tiles in g and r from the SDSS Data Release 12 (Alam et al. 2015). Each tile covers a 1 square degree area put together in an online pipeline provided by the SDSS team, where the tiles overlap by 0.05° on each side, giving a gap-free survey area of ≈330 square degrees and covering the whole M 101 group complex including the vicinities of M 101, M 51, and M 63. Figure 1 shows the footprint of the survey. Also indicated is the much smaller footprint of the Dragonfly survey (van Dokkum et al. 2014; Merritt et al. 2014, 2016; Danieli et al. 2017).
3. Search and detection of new dwarf candidates
Names, coordinates, and morphological types of the 15 new dwarf galaxy candidates of the M 101 group complex.
Lacking the power to resolve new faint dwarf galaxies into stars at that distance, we searched for extended, low-surface-brightness features. The surveyed region contains 29 known dwarf galaxies, with 14 confirmed members via distance measurements, including the most recent Dragonfly dwarfs (Danieli et al. 2017), and 15 candidates where membership was estimated from their photometric and morphological properties. There are also 11 known foreground dwarf galaxies, with distance estimations smaller than 5 Mpc.
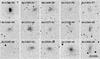 |
Fig. 2 SDSS r-band images of the 15 new M 101 group dwarf galaxy candidates. We note that dw1355+51 is at the edge of the CCD and is not centered in the stamp but offset to the right, and dw1255+40 is barely visible without a strong Gauss convolution. One side of an image corresponds to 80 arcsec or 2.7 kpc at the distance of 7 Mpc. North is to the right, east to the top. |
Each tile was first binned (mapping 9 × 9 pixels onto 1 pixel using the mean value) and convolved with a 3 × 3 pixel Gauss kernel. This dramatically increased the signal-to-noise ratio by a factor of ~30 and thus the visibility of low-surface-brightness features against the background sky. The tiles were visually inspected by two people from our team (OM and RS), where the grayscale was varied such that different dynamical ranges could be examined. This procedure led to the discovery of 15 new dwarf galaxy candidates in the M 101 group complex (red dots in Fig. 1). Their coordinates and morphological classifications are compiled in Table 1 and the candidate images presented in Fig. 2. We classified the candidates according to their morphological appearance: objects that appear symmetric, diffuse, and elliptical as dSph (dwarf spheroidal); objects with an uneven brightness distribution, e.g., due to HII regions, as dIrr (dwarf irregular); and objects with a clumpy high-surface-brightness (HSB) central component and a diffuse halo as blue compact dwarfs (BCD). There are three cases where the morphology is ambiguous. We present the two possible classes separated with a slash, e.g., dIrr/dSph, where the first is the more likely morphological type.
We have assigned each dwarf galaxy candidate to one of the three subgroups (see Table 1). The assignment is based on the shortest angular distance to either M 101, M 51, or M 63. We use the individual parent galaxy’s distance to calculate absolute magnitudes for the new candidates as the distances of the three major galaxies systematically differ.
The biggest challenge of our Cen A survey (Müller et al. 2015, 2017) was the contamination of foreground stars and Galactic nebulae (cirrus). Cirrus can appear in every shape and size and thus can mimic the morphology of a dwarf galaxy. Fortunately, our survey area around M 101 is at high Galactic latitudes (b ≈ 60°), i.e., far away from the Galactic plane where the density of Galactic cirrus and foreground stars is supposedly very small. Hence the problem of false positive detections is minimal.
Nevertheless, we performed artificial galaxy tests to estimate our detection efficiency and the depth (surface brightness limit) of the survey. For this we superimposed artificial galaxies on real images in two different tiles. The profiles for the artificial galaxies were created using a Sérsic profile with n = 1 (exponential profile; see below for the formula). The central surface brightness range was between 23 and 27 mag arcsec2 and the apparent magnitude range between 16 and 20 mag, with a step size of 0.5 mag and 0.5 mag arcsec-2, respectively. At a distance of 6.95 Mpc this corresponds to absolute magnitudes between − 13.2 and − 9.2. This gives a total of 49 galaxies in an array of the surface brightness–absolute magnitude plane to detect per mosaic and iteration. We did five iterations; in each iteration we randomly placed all artificial galaxies into an r band tile. This was repeated for two different tiles such that we had ten iterations in total. In Fig. 3 the results are presented in a μ0,r − Mr diagram. The number of times an artificial galaxy was detected is plotted: zero means no detection and ten corresponds to a 100% detection rate. We do not expect a detection rate of 100% even for clearly detectable galaxies because artificial galaxies can be randomly placed behind bright and extended stars or galaxies. It is important to note that not all parameter combinations lead to reasonable LSB dwarf galaxies, e.g., a high μ0,r value (low SB) together with a small Mr value (relatively high luminosity) will lead to very extended and faint objects, which are not found in the Local Group (see Fig. 6). There is no significant difference in the detection rate between the two different tiles.
It can be seen that essentially all artificial objects with μ0,r ≤ 25.5 r arcsec-2 and Mr ≤ − 11 are detected. A more appropriate completeness boundary of the survey is provided by the following analytic forms (see Ferguson 1990; Ferguson & Sandage 1988):  where all galaxies larger than 2rlim within a given isophotal level of μlim should be detected. The first equation is for the μ0,r − Mr relation; the second equation is for the reff − Mr relation, where reff corresponds to the half-light radius of the object. To calculate the absolute magnitude Mr we assumed a distance of 7 Mpc. We estimated the two parameters such that the completeness boundary would contain all bins of the μ − M array where the detection rate is higher than 70%, resulting in rlim = 13″ and μlim,r = 26.4 r mag arcsec-2. This completeness curve is shown in Fig. 3.
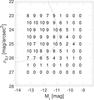 |
Fig. 3 Results of our artificial galaxy detection test shown as an array of numbers indicating the detection efficiency in the surface brightness–absolute magnitude plane. A 10 means 100% detection and a 0 means no detection. The test array is divided into half-magnitude bins. The thin line corresponds to the estimated 70% completeness boundary; see text for the formula. |
The identification of high-surface-brightness dwarf members (against a background of apparently small spiral galaxies) is more difficult and our detection efficiency for these objects cannot easily be assessed by an artificial galaxy test. In general we have to expect that potential high SB dwarf members of the M 101 group complex essentially go unnoticed in our survey. However, one rather convincing case of a blue compact dwarf (BCD, dw1343+58) has been found. On the other hand, a good low SB candidate could of course be in the near background (hence the remark “bg dwarf?” in Table 1, where this seemed equally possible) or the near foreground. In fact, towards the western boundary, the M 101 group region overlaps in the sky with the closer Canes Venatici (CVn) cloud (see also Fig. 1). One candidate in the M 63 subgroup, dw1255+40, is indeed a possible member of that cloud. The problem of confusion is more generally addressed in Sect. 6.1.
We rejected candidates that were close to ultraviolet sources (UvS, e.g., brilliant young foreground stars) listed in the Nasa Extragalactic Database. Such sources can illuminate surrounding dust clouds and make them appear as faint low-surface-brightness objects. While closely resembling the morphology of a dwarf spheroidal galaxy the unusually blue color (g − r< 0.1 mag) of such objects raises doubts that these objects are dwarf candidates. A good example was found at the coordinates 14h09m12s, +51d13m27s, which is only separated from a UvS by 0′.136. It mimics the morphology and has structural parameters of a diffuse dwarf galaxy, but was suspiciously blue.
The reader may wonder why we did not use the SDSS data reduction pipeline directly for the detection of dwarf-like low-surface-brightness objects. There is indeed a tool implemented in the data reduction pipeline for the detection of extended sources. However, Kniazev et al. (2004) pointed out that galaxies are shredded by this tool, as different luminosity knots from the same source are detected and defined as separate, individual SDSS objects. Tests have shown (Kniazev et al. 2004) that the SDSS pipeline tool is unsuited for the detection of LSB objects: it gives a low detection rate of test galaxies and too many false detections. Nevertheless, we checked the SDSS database for the presence of any kind of detection counterpart for our new candidates. Indeed, all our candidates have matches in the SDSS database, but the link between these SDSS objects and a possible group membership of M 101 was not made before the present work. In addition, the SDSS photometry for these low-surface-brightness objects is unreliable, as stated by the SDSS photometry pipeline for those objects. The SDSS database also provides redshifts when available, but none of our candidate galaxies, not even the high-surface-brightness dw1343+58, has a measured redshift.
As alluded to in the introduction, it is interesting to note that six of the seven candidate members from the Dragonfly survey are clearly visible in the SDSS images, thus were redetected in our survey, which strongly suggests that the SDSS data still contains many hidden treasures waiting to be discovered. This is insofar not surprising as the central surface brightness range of these candidates is between 25.1 and 26.8 r mag arcsec-2, which is still detectable according to our artificial galaxy tests.
4. Surface photometry
We performed gr surface photometry for the new candidates in the surveyed area. Cosmic rays, foreground stars, and background galaxies were replaced with patches of sky from the surrounding area using IRAF to maintain the statistical properties of the local sky background. The nominal galaxy center was determined using a circle that best represents the shape of the outer isophotes of the galaxy. We emphasize that this center is a proxy for the underlying mass distribution, but does not necessarily coincide with the location of maximum surface brightness. The sky background was estimated by varying the galaxy growth curve until it became asymptotically flat. For each galaxy we computed the total apparent magnitude, the mean effective surface brightness ⟨ μ ⟩ eff, and the effective radius reff in both bands. We used a circular aperture to measure the surface brightness profiles with a step size of  (corresponding to 1 pixel). Sérsic profiles (Sersic 1968) were fitted at the radial surface brightness profiles using the equation
 where μ0 is the Sérsic central surface brightness, r0 the Sérsic scale length, and n the Sérsic curvature index. See Fig. 4 for all surface brightness profiles in the r band and the associated Sérsic fits.
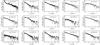 |
Fig. 4 Surface brightness profiles of all dwarf galaxy candidates in r and the best-fitting Sérsic profiles with 1σ confidence intervals. |
The total magnitude uncertainty is estimated to be around ≈0.3 mag. It is made up of uncertainties related to foreground star removal (≈0.2 mag) and sky background estimation (≈0.2 mag). The uncertainty for the mean effective surface brightness is driven by the uncertainty in the measured total apparent magnitude. The error for the half-light radius (≈1.3 arcsec) is given by the determination of the growth curve. See Müller et al. (2015) for a more detailed explanation of the uncertainty estimates. Numerical uncertainties for the Sérsic parameters are shown in Table 2.
To compare our gr photometry and the structural parameters with dwarf galaxies in the literature, we used the following transformation equations (Lupton 2005):  In Müller et al. (2017) we tested the quality of our photometry against literature values. The agreement was well within the uncertainties. In the same spirit, we conducted a comparison of the photometric values for 19 known dwarfs in the field of M 101 taken from Bremnes et al. (1999) with our own SDSS photometry. The values are in excellent agreement within our error estimates (see Fig. 5). We measured a standard deviation of σΔB = 0.18 mag and a mean of μΔB = 0.00 mag was calculated.
As stated earlier, the M 101 survey area is at high Galactic latitudes; therefore, the Galactic extinction values for the g and r band are less than 0.05 mag, much smaller than the photometric uncertainties. Hence, no corrections for Galactic extinction were applied when calculating absolute magnitudes.
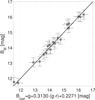 |
Fig. 5 Our photometry for 19 known M 101 dwarf galaxies converted to B band versus the literature values taken from Bremnes et al. (1999). The line corresponds to unity. |
In Table 2 we present the photometric data for the 15 newly detected dwarf galaxy candidates in the M 101 group complex.
Photometric and structural parameters of the new dwarf candidates in the surveyed region of the M 101 group complex.
5. Geometrical alignment
In preparation for an analysis of the spatial structure of the M 101 group complex (Sect. 6.2) we first define a natural spatial reference frame for the complex by fitting a plane through the galaxy positions in the close environment of M 101 itself. In a similar manner, dTully et al. (2015) introduced a reference frame for the Cen A subgroup as the system where two planes of satellites almost lie in the xy-plane, with the normal of the planes corresponding to the z-axis (see also Müller et al. 2016). To find a reference system for the M 101 group we fitted a plane with the help of a singular value decomposition (svd; Golub & Kahan 1965) at all galaxies lying closer than 1.5 Mpc from M 101. The svd method is a technique generally used in linear algebra. It is an eigendecomposition, where the data will be represented by eigenvectors and eigenvalues corresponding to a least-square fit to the data. The resulting sample of eleven galaxies is listed in Table 3. The normal vector of the best fit is given in supergalactic coordinates by nref = (0.6285, − 0.0228, − 0.7775). The plane has a rms thickness of 46 kpc. To see how much the distance uncertainties contribute to the fit, we ran Monte Carlo simulations where we draw the distance of the galaxy from a normal distribution with a 5% distance uncertainty as σ and the literature distance itself as μ. In every run we compared the angle between the normal of our best fit nref with the normal of the run. To determine the contribution of the individual galaxies a second test was conducted. In every run eleven galaxies were randomly drawn from the sample shown in Table 3; each selection was put back into the sample before the next was chosen such that some galaxies might not be chosen, while others might be chosen twice or more (known as a bootstrap test with reshuffle). The angle difference in both tests has a maximum of 1.5 degrees, which clearly indicates that the best-fitting plane is well defined and can be used as statistically robust reference frame.
Galaxies within a r = 1.5 Mpc sphere around M 101 used for the plane fitting.
We choose the x-axis such that it corresponds to the projection of the line of sight onto the plane. The angle between the LoS to M 101 and this new x-axis is only 3.6°, meaning that this plane is lying almost along the LoS. The flat structure extends over 3 Mpc, showing that the plane is not an artifact of distance uncertainties. The x-axis together with the normal vector nref define the reference frame. In order to center M 101 at its origin the supergalactic coordinates need to be shifted by
![Mathematical equation: $$ v_{\rm SG,M\,101} = v_{\rm SG} + \begin{pmatrix} -2.8547 \\ -5.7457 \\ -2.6721 \\ \end{pmatrix} \text{ [Mpc]}. $$](/articles/aa/full_html/2017/06/aa30434-17/aa30434-17-eq130.png) The transformation from the shifted supergalactic coordinates to the reference system is then given by the following rotation matrix
The transformation from the shifted supergalactic coordinates to the reference system is then given by the following rotation matrix
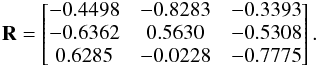 The final transformation is
 The best-fitting (reference) plane is shown and discussed below (Sect. 6.2, Fig. 7).
We note that the geometrical analysis was initially performed before the distance of three additional Dragonfly galaxies were published (Danieli et al. 2017). Including these new galaxies (DF1, DF2, DF3) the normal of the best-fitting plane changes only by an angle of 0.4 degrees, showing that the plane is statistically robust. With the additional three galaxies the rms thickness of the plane decreased from 49 kpc to 46 kpc.
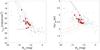 |
Fig. 6 Left: μ0–MV relation for the photometric parameters of the known Local Group dwarfs (gray dots, McConnachie 2012) and the new candidates (red squares). Indicated by the thin line is the assumed completeness boundary (Sect. 3) at 7 Mpc, which is bracketed by lines corresponding to assumed distances of 5 Mpc and 10 Mpc to take care of the expected distance spread. Right: same data and color-coding, but for the log reff–MV relation. |
6. Analysis and discussion
In this section we assess the possible membership of the candidates based on their photometric properties, and we analyze the structure of the M 101 group and the whole complex in the light of the enlarged sample.
6.1. New dwarf galaxy candidates
The usual way to test group membership of dwarf galaxies without direct distance measurements is by comparing their photometric parameters with those of confirmed dwarf galaxies with known distances (e.g., Jerjen et al. 2000; Chiboucas et al. 2009; Merritt et al. 2014; Müller et al. 2017). Dwarf galaxies tend to follow a fairly narrow relation in the central surface brightness–absolute magnitude diagram and the effective radius–absolute magnitude diagram (see Fig. 6). We note that the central surface brightness is a distance-independent quantity. If a candidate is a background galaxy not associated with the group or complex, the assumed distance for calculating MV will place the galaxy outside of the relation. In other words, if the parameter values of a candidate fit into the relation with the assumed distance, they are comparable to those of known dwarf galaxies and the candidate can be associated with the group. This convenient test gives us a preliminary, rough handle on the membership status before embarking on a time consuming confirmation by direct distance measurements.
The performance of the present dwarf candidates in this photometric test is shown in Fig. 6. We note that we have assumed different distances for our candidates depending on their position relative to the major galaxy they are assigned to (Table 1), roughly 7 Mpc around M 101 and 9 Mpc around M 51/M 63. Moreover, given that the dwarfs, even as members of the complex, will be distributed in a large halo around the subgroups, we have to allow for – or expect – a total distance spread of the candidates from ~5 to 10 Mpc, giving rise to an additional spread in the photometric relations. The distance spread is also taken care of by overlaying in the relations shown in Fig. 6 a set of completeness boundaries (cf. Sect. 3) for distances of 5, 7, and 10 Mpc.
Figure 6 shows that all but one of the new dwarf candidates fit into both of the relations, thus suggesting, or at least being in agreement with, their membership in the M 101 group complex. We note that the outlier is a BCD which does not have to fit into the relations.
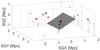 |
Fig. 7 3D distribution, in supergalactic coordinates, of all galaxies with distance measurements in the surveyed M 101 group complex, centered at M 101. The red dots correspond to the major galaxies M 101, M 51, and M 63; the black dots indicate dwarf galaxies. The gray dots (shadows) appearing on the SGXSGZ– and SGYSGZ–walls are orthogonal projections. The best-fitting plane through the M 101 subgroup is shown as the gray plane and has a rms of only 46 kpc. The line of sight between the Milky Way and M 101 is indicated by the thick black line pointing downwards. |
The membership status of dw1343+58 which we classified as a blue compact dwarf (BCD) has to be assessed in a different way. Morphologically, the galaxy consists of a high-surface-brightness irregular central region and an elliptical low-surface-brightness component around it, which is characteristic for BCDs (e.g., Kunth et al. 1988). Papaderos et al. (1996a,b) studied the optical structure of BCDs by decomposing their surface brightness profiles into three parts: (i) an underlying extended low-surface-brightness component; (ii) an exponential plateau which is mostly seen in iE BCDs; and (iii) an inner HSB region exhibiting a luminosity excess over the plateau which can be fitted with a Gaussian profile. Papaderos et al. (1996a) give the 25 mag isophote radius in the R-band of the HSB Gaussian component (P25) for a sample of BCDs (see their Table 5). If we exclude the outliers Haro 2, Mkn 297, and I Zw 89, we end up with a mean size of P25 = 0.55 kpc for BCDs. Now, the estimated P25 size of our candidate dw1343+58 is ~15″. Assuming P25 = 0.55 kpc would then put it at a distance of 7.8 Mpc, which is indeed in accord with M 101 group membership. We note that this candidate is listed as a galaxy in the HYPERLEDA catalog (Paturel et al. 2003), but not as a BCD or a M 101 dwarf.
As mentioned, the Canes Venatici (CVn) cloud of galaxies is partially overlapping with the M 101 group complex in sky projection. It is conventionally split at a line-of-sight velocity division line of 400 km s-1 (~5.7 Mpc) into the CVn I and CVn II clouds. CVn I cloud members peak at ~300 km s-1 (~4.2 Mpc) and CVn II cloud members at ~560 km s-1 (~8.0 Mpc) (Makarov et al. 2013). The whole CVn complex is an extended structure consisting mostly of late-type galaxies of low luminosity and is part of the Coma-Sculptor Cloud, a huge (~10 Mpc long) prolate filament, which also includes the Sculptor Cloud, the Local Group, the M 81 group, and the Cen A group (Tully 1988; Karachentsev et al. 2003). In our search area, 11 known galaxies have distances smaller than 5.0 Mpc, identifying them as part of the CVn I cloud. So, it is conceivable that some of our candidates could in fact be foreground dwarf galaxies. In particular, spiral galaxy M 94 at a distance of 4.5 Mpc (Karachentsev et al. 2003), one of the major members of CVn I (Makarov et al. 2013), is less than 0.5 degrees off our search border (at 12h50m53.5s +41d07m10s). The dwarf candidate dw1255+40 is at a projected distance of only 0.95 degrees from M 94, corresponding to a separation of 75 kpc at the distance of M 94. Placing this candidate in the vicinity of M 94 (at 4.5 Mpc) rather than in the M 101 group complex (at 7 or 9 Mpc) would still be fine for the photometric test, i.e., the adjusted structural parameters of the candidate would still fit into the relations. Here, a direct distance measurement is needed to confirm its membership in either structure.
6.2. Structure of the M 101 group complex
How do these new dwarf galaxy candidates fit into the group complex? We now focus on the structure and geometry of the complex and discuss its impact on the formation history. The 15 galaxies with known distances in the survey region are plotted in supergalactic coordinates and centered at M 101 in Fig. 7. Also shown is the best-fitting plane through eight members of the M 101 subgroup, as calculated in Sect. 5. The galaxies are cast orthogonally onto the SGXSGZ– and SGYSGZ–planes, where they appear as shadows. The highly flattened filamentary distribution of the galaxies, especially in the SGXSGZ–plane, is quite striking. The M 101 plane is a good representation of the whole complex, i.e., the planar structure of the M 101 subgroup is embedded in a larger flattened structure that encompasses what we call the M 101 group complex.
To further study this flat structure and locate our dwarf candidates in it we now switch to the M 101 reference frame introduced in Sect. 5. In this system the best fit corresponds to the M 101XM 101Y–plane, which has its origin at (0,0,0). As previously mentioned, the normal of the best-fitting plane is almost perpendicular to the LoS. When this normal is perpendicular to the LoS, then the LoS for the dwarf galaxy candidates will be (almost) parallel to the best-fitting plane. As the plane is not perfectly parallel to our view, the LoS of the candidates will be systematically shifted along the negative direction of the M 101Z–axis. The M 101XM 101Z– and M 101XM 101Y–projections in this reference system are shown in Fig. 8. In the top left panel the galaxies with known distances and their 5% uncertainties are shown. In the top right panel the possible positions of the candidates (dwarfs presented here and the candidates taken from the LV Catalog) are indicated by lines. All lines have a relatively shallow slope and cover between 0.06 Mpc and 0.35 Mpc in the M 101Z direction over an interval of 3.25 Mpc along the M 101X–axis (or LoS depth of the M 101 group complex). This narrow spread in M 101Z enables us to study the possible distribution of the candidates without exact knowledge of their distances. All we need are the sky positions and the fact that the M 101 group complex is flattened almost along the LoS. In the edge-on view it is easy to determine whether or not a candidate is part of the filamentary structure. The bottom panels show the structure in the M 101XM 101Y–plane, giving a face-on view onto the best-fitting plane.
Looking at the M 101XM 101Z–projection (the edge-on view, top right of Fig. 8) we first verify that almost all known galaxies in the region, notably M 51 and M 63, are close to the best-fitting plane through the M 101 subgroup (the thick red dotted line). That plane through eight members of the subgroup had a rms thickness of 46 kpc. If instead a fit is performed at all 16 galaxies lying along the planar structure (KH 87, M 63, M 51, NGC 5195, UGC 08882, KK 191, Holm IV, M 101, NGC 5474, DF2, NGC 5477, DF3, DF1, NGC 5023, NGC 5585, and DDO 194), we calculate a rms = 67 kpc, which is still remarkably thin. Only DDO 182 falls outside of the structure. Moreover, it is clearly visible that most of the candidate dwarfs lie within (or near) the flattened structure outlined by the know members of the M 101 group complex.
Looking at the M 101XM 101Y–projection (face-on view, bottom right) we note that only three candidates lie in the space between M 101 and M 51 (ignoring the lines close to M 101). This is further evidence that the M 101 and M 51/M 63 subgroups form separate groups as suggested by Tikhonov et al. (2015). Most new dwarf candidates are in the direction of M 101.
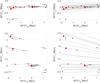 |
Fig. 8 M 101XM 101Z–projection (top) and M 101XM 101Y–projection (bottom) of known members and candidate members of the M 101 group complex in the M 101 reference system. The top panels essentially give an edge-on view of the complex, the bottom panels a face-on view. Red dots correspond to the three major galaxies M 101, M 51, and M 63; black dots indicate dwarf galaxies with distances. The thick red dotted line is the best-fitting (reference) plane lying in the M 101XM 101Y–plane. The left panels show the known members with 5% distance errors indicated by the short lines along the LoS. The right panels additionally give the possible positions of our new dwarf candidates and the candidates from the LV Catalog, in absence of distance measurements shown as long thin black lines again running along their LoS. |
With a length of over 3 Mpc this flattened structure could be attributed to the cosmic web where the galaxies are known to be aligned along dark matter filaments. The question, then, is how this structure compares to other filamentary structures. Bond et al. (2010) identified individual filamentary structures in SDSS and compared their properties to those produced in cosmological simulations. They found a mean SDSS filament width of 5.5 ± 1.1 or 8.4 ± 1.4h-1 Mpc, depending on the smoothing length, which in size is comparable to our best-fitting plane (~3 Mpc) when the bottom panel of Fig. 8 is taken as a measure. However, the thickness of the M 101 complex of only rms = 67 kpc is remarkable. This is a factor of ~40 smaller than the size of the structure.
A direct comparison with simulations is difficult. González & Padilla (2010) used an algorithm to identify and analyze filaments in cosmological simulations. They plotted the filament thickness as a function of the filament length with a bin size of 10 Mpc. In the first bin (0 to 10 Mpc) a median thickness of 1.3 Mpc is estimated. The problem with this result for the purpose of comparison is the low resolution of filament length steps. In their Fig. 8 (upper right panel) they present the count of filaments as a function of thickness. There is a small signal at 0.1 Mpc h-1, but it remains unclear whether this is due to the interpolation between zero and the first point of the function rather than being a real signal. Even when we assume that it is a real signal, the probability of a thickness as small as that observed in the M 101 group complex is essentially zero. If the M 101 group complex is the usual type of a large-scale filamentary structure, its small thickness has to be explained.
One possible explanation for this special configuration is given by the presence of the nearby Local Void (see Courtois et al. 2013). The planar M 101 group complex is well-aligned at the edge of the Local Void and can be seen as part of its boundary. The formation of the flattened structure itself could be induced by the expansion of the Local Void.
Regarding the thin planar structure of the M 101 subgroup itself, with its very small rms thickness of 46 kpc, the question arises of whether this could be a similar phenomenon to the local planes: the Vast Polar Structure (VPOS) of the Milky Way (Pawlowski et al. 2012) or the Great Plane of Andromeda (GPoA, Ibata et al. 2013). Much of the motivation for finding new faint dwarf galaxies outside the LG is precisely to look for analoguous structures because the local planes are a challenge to the standard ΛCDM scenario of structure formation (e.g., Pawlowski et al. 2014; Cautun & Frenk 2017). However, we believe that the M 101 plane is not the same phenomenon, even though the M 101 plane is only a factor of two or three thicker than the local planes. The scales and the objects that define the planes are different. The local planes are defined by very faint and ultra-faint dwarf satellites in the immediate vicinity of their host galaxies (closer than the virial radius of 250 kpc). In contrast, the M 101 plane is defined by still fairly luminous dwarf galaxies at separations as large as 1 Mpc. Still, the flattened structure of the M 101 subgroup – and its extension over the whole complex – is remarkable.
How is the galaxy M 101 itself inclined to the group plane? As mentioned in Sect. 4 the spiral galaxy M 101 is seen face-on, which means that our LoS essentially coincides with the direction of the disk normal nM 101 = (0.4107,0.8267,0.3845) in supergalactic cartesian coordinates. Hence, with an angle of only 3.6° between nM 101 and the planar structure of the group, the disk of M 101 is perpendicular and its normal is parallel to the plane. Dubois et al. (2014) studied the alignment of galaxy spins within the Cosmic Web with a large-scale hydrodynamical cosmological simulation and found that more massive galaxies tend to have their spin direction perpendicular to a filament, while less massive galaxies have their spin direction preferentially parallel to a filament with a transition mass around M∗ ≈ 3 × 10¹⁰M⊙. Tikhonov et al. (2015) calculated a dynamical mass for M 101 of 6.2 × 10¹¹ M⊙ and gave a mass-to-light (M/L) ratio of 18, thus the stellar mass of M 101 would be 3.4 × 10¹⁰ M⊙, assuming M/L = 1 for the stellar component. Hence, the stellar mass of M 101 is just around the Dubois transition mass and either way is in agreement with this work. A follow-up study based on the same simulation framework (Welker et al. 2014) revealed a strong correlation between the merger history and the spin alignment: the more mergers contribute to the mass of a galaxy, the more likely its spin will be perpendicular to the filament. In contrast, the spin of galaxies with no merger is more likely aligned with the filament. This would then suggest that M 101 has undergone few or no mergers in its formation history. This view agrees well with the observation that M 101 has a small (or essentially absent) bulge; in the standard model of bottom-up structure formation, bulges are formed in merger events (e.g., Brooks & Christensen 2016, and references therein).
The lack of a strong bulge in M 101 is an important observation in itself. Kormendy et al. (2010) pointed out the challenge of bulgeless spiral galaxies for hierarchical formation scenarios. How can such massive spiral galaxies like M 101 form out of merger events without growing a prominent bulge? López-Corredoira & Kroupa (2016) showed that there is a correlation between bulge size and the number of tidal dwarf galaxies (NS). However, in a ΛCDM scenario there should be no correlation between these two quantities because NS is driven by the dark matter mass of the host galaxy and not by its formation history (Kroupa et al. 2010). In a generalized model of gravity without DM one does expect such a correlation between the bulge and NS because (tidal dwarf) satellites form in rare fly-by encounters. Bulges themselves would also form in such encounters, making the bulge-to-disk ratio a measure for past interactions (López-Corredoira & Kroupa 2016). What would such a scenario predict for the M 101 group? As M 101 is a spiral galaxy without a bulge, only a few or even no dwarf spheroidals should exist in the group. Karachentsev et al. (2005) reported that bulgeless galaxies generally have no or only a few known dwarf spheroidal companions. To date only three early-type dwarfs have been confirmed as members of the M 101 group. While in a generalized gravity scenario this missing dSph problem is well explained, the standard model of cosmology needs to find a mechanism for the low abundance of dwarf spheroidals around bulgeless spirals.
How do our new dwarf detections fit into this picture? This can be evaluated by way of a comparison with the Andromeda subgroup. In Chiboucas et al. (2009) the authors show the cumulative luminosity functions (LF) of the Cen A, M 81 and Andromeda satellites. Our survey reached a limiting magnitude of MV ~ − 10 mag, assuming a distance of 7 Mpc. Among the three satellite populations, the cumulative LF of the Andromeda subgroup shows the lowest abundance with 15 satellites down to MV = − 10 mag. Andromeda and M 101 also have a similar total B-band luminosity (ΔB ≈ 0.5 mag), thus a comparison is reasonable. Within a projected virial radius of ≈260 kpc around M 101 (Merritt et al. 2014), comparable to Andromeda with 230 kpc, there are seven confirmed members (Holm IV, UGC 08882, DF3, DF1, NGC 5474, NGC 5477, DF2) down to V magnitude of − 10 (three early-type and four late-type dwarfs). Additionally, there are five dwarf candidates within this radius (M 101 dwD, M 101 dwC, M 101 dwA, M 101 dwB, dw1412+56). Assuming a distance of 6.95 Mpc for all of them, five additional members would contribute to the population, giving a total of twelve, putting the M 101 subgroup almost on a par with the Andromeda subgroup. On the other hand, assuming a positive detection rate of 60% (14 out of 22 candidates of the M 81 group were confirmed as members (Chiboucas et al. 2013), the rest being background or cirrus) we would gain only three additional members, for a total of ten satellites. This, in turn, would indeed indicate a smaller population of dwarf galaxies in the M 101 subgroup. Using all distance data available and calculating the 3D distances to M 101, only three (NGC 5474, NGC 5477, DF2) of the seven galaxies lying in the projected virial radius are closer than 260 kpc to M 101, drastically increasing the missing-satellite problem in the M 101 subgroup. Similarly, Danieli et al. (2017) draw the same conclusion with their recent publication of HST data for their Dragonfly candidates. The authors also cautiously predict a too-big-to-fail problem for the M 101 subgroup, based on the low abundance of bright dwarf satellites around M 101. Clearly, we need distance measurements for the dwarf candidates in the vicinity of M 101 to answer the question of whether, as claimed, the abundance of dwarf satellites of M 101 is exceptionally low, and hence whether there really is a missing-satellite problem in the M 101 subgroup. In this context it is noteworthy that there are almost no new candidates in the virial radii of all three host galaxies. Could we face similar problems in the M 51 and M 63 subgroups?
The alignment of the spin vector with the planar structure and the low number of M 101 dwarf satellites – if confirmed – lead to the conclusion that M 101 has a weak merger history. Additional evidence for this is given by van Dokkum et al. (2014) who point out a lack of a stellar halo of M 101. Such stellar halos are formed from debris of shredded satellite galaxies (McConnachie et al. 2009), and are an indicator of previous interaction. Does all this evidence mean that there is no evidence for interaction in the galaxy group? Mihos et al. (2013) studied the faint outskirts of the spiral up to a limiting surface brightness (star density) of μB ~ 29.5 mag arcsec-2 and found no evidence of extended stellar tidal tails around M 101 or its companions. Such tails should be expected when M 101 had a recent encounter with one of its massive companions. However, two low-surface-brightness features were found in the outer disk. One of them must have formed very recently, due to its blue stellar population. The authors argue that this faint blue feature could have formed in fly-by encounters with NGC 5477 and NGC 5474. The latter galaxy exhibits an off-centered central bulge, suggesting some interaction in the past. The high-velocity gas in the disk of M 101 is another indicator of tidal interaction, possibly with the companion NGC 5477 (Combes 1991).
More prominent than M 101 in terms of interaction is the ongoing merger between M 51 and NGC 5195 (Toomre & Toomre 1972). In Dobbs et al. (2010) this merger was simulated with a hydrodynamical model with a highly elliptical orbit where NGC 5195 passes trough the disk of M 51 twice. A qualitative assessment of the trajectory of NGC 5195 shows that it correlates with our best-fitting plane, which is not surprising, as accretion happens along the filament (Libeskind et al. 2014).
In contrast to more distant dwarf galaxy candidates (e.g., Ordenes-Briceño et al. 2016; Smith Castelli et al. 2016, d> 20 Mpc), the new dwarf galaxy candidates in the M 101 group complex can be resolved into stars with appropriate equipment from the ground (e.g., Subaru) or in space (HST). The task is to confirm these objects as nearby stellar systems, excluding the possibility that they are more distant, unresolved galaxies or Galactic cirrus clouds, Measuring their distances also allows us to assign each of them to one of the three subgroups in the M 101 group complex (or the Canes Venatici I cloud in the foreground). Will the candidates spread along the 3 Mpc sheet or are they clustered around the main galaxies M 101, M 51, and M 63? Accurate distance measurements will be key for the study of the fine structure of large-scale structure in the M 101 group filament.
7. Conclusion
In this work we presented the results of a dwarf galaxy search covering the M 101 group of galaxies and its wider environment including M 51 and M 63 with publicly available data from the Sloan Digital Sky Survey. We searched a sky area of 330 square degrees and found 15 new dwarf candidates. Surface photometry was performed for all candidates in the gr bands and Sérsic profiles were fitted to the surface brightness profiles. We tested the group membership with the classical tools at hand: the central surface brightness–absolute magnitude and effective radius–absolute magnitude relations. The candidates indeed fit in comparison to the structural parameters of known Local Group dwarf galaxies, making them good candidates of the M 101 group complex. Distance measurements are nevertheless needed to confirm these results. We discussed the possibility that some of the candidates could be dwarf members of the Canes Venatici cloud in the near foreground.
The second part of this work was committed to the 3D spatial distribution of the group and the whole complex. We found that all but one of the galaxies with known distances lie in a thin plane with rms = 67 kpc and a length of over 3 Mpc, including M 51 and M 63. The plane was defined by a best fit at the M 101 subgroup alone, i.e., M 101 and its neighbors within 1.5 Mpc, with a rms thickness of only 46 kpc. The recent publication of three additional dwarf galaxies (Danieli et al. 2017) strengthens the picture of a thin, planar structure. This structure happens to be well-aligned with our line of sight, giving us the opportunity to place the new dwarf candidates relative to this plane without knowing their exact distances. For this we defined a M 101 reference frame where the z-axis corresponds to the normal of the plane.
The flattened structure of the M 101 group complex is aligned with the envelope of the Tully Void which could explain its formation by the expansion of the void. There is a clear alignment between the spin direction of M 101 and the planar structure: the spiral disk of M 101 is almost perpendicular to the best-fitting plane. In a ΛCDM scenario this can be explained by a weak merger history. The missing bulge of M 101 also strengthens the case for a steady evolution over long periods of time, rather than via episodic merger events. We discussed the impact of such a formation history with the abundance of dwarf spheroidals in a ΛCDM and a generalized gravity scenario.
Future distance measurements of the candidates in the M 101 group complex will give us answers to the questions of whether the planar structure is only an artifact of small number statistics or a real cosmic structure, and if the latter is true, how thin it is and what the implications are. Will the candidates cluster around the main galaxies or are they more widely distributed along this filament?
Acknowledgments
O.M. and B.B. are grateful to the Swiss National Science Foundation for financial support. H.J. acknowledges the support of the Australian Research Council through Discovery Project DP150100862. The authors thank Marcel Pawlowski and Marina Rejkuba for interesting discussions and helpful input. The authors would like to thank the anonymous referee for the helpful comments that improved the paper.
References
- Alam, S., Albareti, F. D., Allen de Prieto, C., et al. 2015, ApJS, 219, 12 [NASA ADS] [CrossRef] [Google Scholar]
- Belokurov, V., Walker, M. G., Evans, N. W., et al. 2010, ApJ, 712, L103 [NASA ADS] [CrossRef] [Google Scholar]
- Binggeli, B. 1989, in Large Scale Structure and Motions in the Universe, eds. M. Mezzetti, G. Giuricin, F. Mardirossian, & M. Ramella, Astrophys. Space Sci. Lib., 151, 47 [Google Scholar]
- Binggeli, B., Tammann, G. A., & Sandage, A. 1987, AJ, 94, 251 [NASA ADS] [CrossRef] [Google Scholar]
- Bond, N. A., Strauss, M. A., & Cen, R. 2010, MNRAS, 409, 156 [NASA ADS] [CrossRef] [Google Scholar]
- Bremnes, T., Binggeli, B., & Prugniel, P. 1999, A&AS, 137, 337 [NASA ADS] [CrossRef] [EDP Sciences] [Google Scholar]
- Brooks, A., & Christensen, C. 2016, Galactic Bulges, 418, 317 [NASA ADS] [CrossRef] [Google Scholar]
- Carrillo, A., Bell, E. F., Bailin, J., et al. 2017, MNRAS, 465, 5026 [NASA ADS] [CrossRef] [Google Scholar]
- Cautun, M., & Frenk, C. S. 2017, MNRAS, 468, L41 [NASA ADS] [CrossRef] [Google Scholar]
- Cautun, M., Bose, S., Frenk, C. S., et al. 2015, MNRAS, 452, 3838 [NASA ADS] [CrossRef] [Google Scholar]
- Chiboucas, K., Karachentsev, I. D., & Tully, R. B. 2009, AJ, 137, 3009 [NASA ADS] [CrossRef] [Google Scholar]
- Chiboucas, K., Jacobs, B. A., Tully, R. B., & Karachentsev, I. D. 2013, AJ, 146, 126 [NASA ADS] [CrossRef] [Google Scholar]
- Combes, F. 1991, A&A, 243, 109 [NASA ADS] [Google Scholar]
- Courtois, H. M., Pomarède, D., Tully, R. B., Hoffman, Y., & Courtois, D. 2013, AJ, 146, 69 [NASA ADS] [CrossRef] [Google Scholar]
- Crnojević, D., Sand, D. J., Caldwell, N., et al. 2014, ApJ, 795, L35 [NASA ADS] [CrossRef] [Google Scholar]
- Crnojević, D., Sand, D. J., Spekkens, K., et al. 2016, ApJ, 823, 19 [NASA ADS] [CrossRef] [Google Scholar]
- Danieli, S., van Dokkum, P., Merritt, A., et al. 2017, ApJ, 837, 136 [NASA ADS] [CrossRef] [Google Scholar]
- Dobbs, C. L., Theis, C., Pringle, J. E., & Bate, M. R. 2010, in Galaxy Wars: Stellar Populations and Star Formation in Interacting Galaxies, eds. B. Smith, J. Higdon, S. Higdon, & N. Bastian, ASP Conf. Ser., 423, 240 [Google Scholar]
- Dubois, Y., Pichon, C., Welker, C., et al. 2014, MNRAS, 444, 1453 [NASA ADS] [CrossRef] [Google Scholar]
- Ferguson, H. C. 1990, Ph.D. Thesis, Johns Hopkins Univ., Baltimore, MD, USA [Google Scholar]
- Ferguson, H. C., & Sandage, A. 1988, AJ, 96, 1520 [NASA ADS] [CrossRef] [Google Scholar]
- Golub, G., & Kahan, W. 1965, SIAM J. Num. Anal., 2, 205 [NASA ADS] [Google Scholar]
- González, R. E., & Padilla, N. D. 2010, MNRAS, 407, 1449 [NASA ADS] [CrossRef] [Google Scholar]
- Gunn, J. E., Siegmund, W. A., Mannery, E. J., et al. 2006, AJ, 131, 2332 [NASA ADS] [CrossRef] [Google Scholar]
- Ibata, R. A., Lewis, G. F., Conn, A. R., et al. 2013, Nature, 493, 62 [CrossRef] [Google Scholar]
- Jacobs, B. A., Rizzi, L., Tully, R. B., et al. 2009, AJ, 138, 332 [NASA ADS] [CrossRef] [MathSciNet] [Google Scholar]
- Javanmardi, B., Martinez-Delgado, D., Kroupa, P., et al. 2016, A&A, 588, A89 [NASA ADS] [CrossRef] [EDP Sciences] [Google Scholar]
- Jerjen, H., Binggeli, B., & Freeman, K. C. 2000, AJ, 119, 593 [NASA ADS] [CrossRef] [Google Scholar]
- Karachentsev, I. D., Kopylov, A. I., & Kopylova, F. G. 1994, Bulletin of the Special Astrophysics Observatory, 38, 5 [NASA ADS] [Google Scholar]
- Karachentsev, I. D., Sharina, M. E., Dolphin, A. E., et al. 2003, A&A, 398, 467 [NASA ADS] [CrossRef] [EDP Sciences] [Google Scholar]
- Karachentsev, I. D., Karachentseva, V. E., Huchtmeier, W. K., & Makarov, D. I. 2004, AJ, 127, 2031 [Google Scholar]
- Karachentsev, I. D., Karachentseva, V. E., & Sharina, M. E. 2005, in Near-fields cosmology with dwarf elliptical galaxies, eds. H. Jerjen, & B. Binggeli, IAU Colloq. 198, 295 [Google Scholar]
- Karachentsev, I. D., Makarov, D. I., & Kaisina, E. I. 2013, AJ, 145, 101 [NASA ADS] [CrossRef] [Google Scholar]
- Kim, D., Jerjen, H., Mackey, D., Da Costa, G. S., & Milone, A. P. 2015, ApJ, 804, L44 [NASA ADS] [CrossRef] [Google Scholar]
- Kniazev, A. Y., Grebel, E. K., Pustilnik, S. A., et al. 2004, AJ, 127, 704 [NASA ADS] [CrossRef] [Google Scholar]
- Kormendy, J., Drory, N., Bender, R., & Cornell, M. E. 2010, ApJ, 723, 54 [NASA ADS] [CrossRef] [Google Scholar]
- Kroupa, P. 2012, PASA, 29, 395 [NASA ADS] [CrossRef] [Google Scholar]
- Kroupa, P., Famaey, B., de Boer, K. S., et al. 2010, A&A, 523, A32 [NASA ADS] [CrossRef] [EDP Sciences] [Google Scholar]
- Kunth, D., Maurogordato, S., & Vigroux, L. 1988, A&A, 204, 10 [NASA ADS] [Google Scholar]
- Libeskind, N. I., Knebe, A., Hoffman, Y., & Gottlöber, S. 2014, MNRAS, 443, 1274 [NASA ADS] [CrossRef] [Google Scholar]
- López-Corredoira, M., & Kroupa, P. 2016, ApJ, 817, 75 [NASA ADS] [CrossRef] [Google Scholar]
- Lupton, R. 2005, Transformations between SDSS magnitudes and other systems https://www.sdss3.org/dr10/algorithms/sdssUBVRITransform.php/ [Google Scholar]
- Makarov, D. I., Makarova, L. N., & Uklein, R. I. 2013, Astrophysical Bulletin, 68, 125 [NASA ADS] [CrossRef] [Google Scholar]
- McConnachie, A. W. 2012, AJ, 144, 4 [NASA ADS] [CrossRef] [Google Scholar]
- McConnachie, A. W., Irwin, M. J., Ibata, R. A., et al. 2009, Nature, 461, 66 [NASA ADS] [CrossRef] [PubMed] [Google Scholar]
- McQuinn, K. B. W., Skillman, E. D., Dolphin, A. E., Berg, D., & Kennicutt, R. 2016, ApJ, 826, 21 [NASA ADS] [CrossRef] [Google Scholar]
- Merritt, A., van Dokkum, P., & Abraham, R. 2014, ApJ, 787, L37 [NASA ADS] [CrossRef] [Google Scholar]
- Merritt, A., van Dokkum, P., Danieli, S., et al. 2016, ApJ, 833, 168 [NASA ADS] [CrossRef] [Google Scholar]
- Mihos, J. C., Harding, P., Spengler, C. E., Rudick, C. S., & Feldmeier, J. J. 2013, ApJ, 762, 82 [NASA ADS] [CrossRef] [Google Scholar]
- Müller, O., Jerjen, H., & Binggeli, B. 2015, A&A, 583, A79 [NASA ADS] [CrossRef] [EDP Sciences] [Google Scholar]
- Müller, O., Jerjen, H., Pawlowski, M. S., & Binggeli, B. 2016, A&A, 595, A119 [NASA ADS] [CrossRef] [EDP Sciences] [Google Scholar]
- Müller, O., Jerjen, H., & Binggeli, B. 2017, A&A, 597, A7 [NASA ADS] [CrossRef] [EDP Sciences] [Google Scholar]
- Nataf, D. M. 2015, MNRAS, 449, 1171 [NASA ADS] [CrossRef] [Google Scholar]
- Ordenes-Briceño, Y., Taylor, M. A., Puzia, T. H., et al. 2016, MNRAS, 463, 1284 [NASA ADS] [CrossRef] [Google Scholar]
- Papaderos, P., Loose, H.-H., Fricke, K. J., & Thuan, T. X. 1996a, A&A, 314, 59 [NASA ADS] [Google Scholar]
- Papaderos, P., Loose, H.-H., Thuan, T. X., & Fricke, K. J. 1996b, A&AS, 120, 207 [NASA ADS] [CrossRef] [EDP Sciences] [Google Scholar]
- Paturel, G., Petit, C., Prugniel, P., et al. 2003, A&A, 412, 45 [NASA ADS] [CrossRef] [EDP Sciences] [Google Scholar]
- Pawlowski, M. S., Pflamm-Altenburg, J., & Kroupa, P. 2012, MNRAS, 423, 1109 [NASA ADS] [CrossRef] [Google Scholar]
- Pawlowski, M. S., Kroupa, P., & Jerjen, H. 2013, MNRAS, 435, 1928 [NASA ADS] [CrossRef] [Google Scholar]
- Pawlowski, M. S., Famaey, B., Jerjen, H., et al. 2014, MNRAS, 442, 2362 [NASA ADS] [CrossRef] [Google Scholar]
- Pawlowski, M. S., Famaey, B., Merritt, D., & Kroupa, P. 2015, ApJ, 815, 19 [NASA ADS] [CrossRef] [Google Scholar]
- Rekola, R., Jerjen, H., & Flynn, C. 2005, A&A, 437, 823 [NASA ADS] [CrossRef] [EDP Sciences] [Google Scholar]
- Rizzi, L., Held, E. V., Saviane, I., Tully, R. B., & Gullieuszik, M. 2007, MNRAS, 380, 1255 [NASA ADS] [CrossRef] [MathSciNet] [Google Scholar]
- Sand, D. J., Crnojević, D., Strader, J., et al. 2014, ApJ, 793, L7 [NASA ADS] [CrossRef] [Google Scholar]
- Sersic, J. L. 1968, Atlas de galaxias australes (Cordoba, Argentina: Observatorio Astronomico) [Google Scholar]
- SmithCastelli, A. V., Faifer, F. R., & Escudero, C. G. 2016, A&A, 596, A23 [NASA ADS] [CrossRef] [EDP Sciences] [Google Scholar]
- Taylor, M. A., Muñoz, R. P., Puzia, T. H., et al. 2016, MNRAS, submitted [arXiv:1608.07285] [Google Scholar]
- Taylor, M. A., Puzia, T. H., Muñoz, R. P., et al. 2017, MNRAS, 469, 3444 [NASA ADS] [CrossRef] [Google Scholar]
- Tikhonov, N. A., Lebedev, V. S., & Galazutdinova, O. A. 2015, Astron. Lett., 41, 239 [NASA ADS] [CrossRef] [Google Scholar]
- Tonry, J. L., Dressler, A., Blakeslee, J. P., et al. 2001, ApJ, 546, 681 [NASA ADS] [CrossRef] [Google Scholar]
- Toomre, A., & Toomre, J. 1972, in BAAS, 4, 214 [Google Scholar]
- Trentham, N., & Tully, R. B. 2002, MNRAS, 335, 712 [NASA ADS] [CrossRef] [Google Scholar]
- Tully, R. B. 1988, Nearby galaxies catalog (Cambridge and New York: Cambridge University Press) [Google Scholar]
- Tully, R. B., Libeskind, N. I., Karachentsev, I. D., et al. 2015, ApJ, 802, L25 [Google Scholar]
- van Dokkum, P. G., Abraham, R., & Merritt, A. 2014, ApJ, 782, L24 [NASA ADS] [CrossRef] [Google Scholar]
- Welker, C., Devriendt, J., Dubois, Y., Pichon, C., & Peirani, S. 2014, MNRAS, 445, L46 [NASA ADS] [CrossRef] [Google Scholar]
- York, D. G., Adelman, J., Anderson, Jr., J. E., et al. 2000, AJ, 120, 1579 [CrossRef] [Google Scholar]
All Tables
Names, coordinates, and morphological types of the 15 new dwarf galaxy candidates of the M 101 group complex.
Photometric and structural parameters of the new dwarf candidates in the surveyed region of the M 101 group complex.
All Figures
|
Fig. 1 Survey area of ≈330 square degrees in the M 101 group region. The black triangles are confirmed dwarf galaxies with distances in the M 101 group complex. The small black dots are members based on their photometric properties, compiled from the Local Volume Catalog (Karachentsev et al. 2004, 2013). The large black dots are the major galaxies that define the three subgroup centers in the region: M 101 (14h03m12.5s + 54d20m56s), M 51 (13h29m52.7s + 47d11m43s), and M 63 (13h15m49.3s +42d01m45s). The red dots indicate the positions of our 15 new dwarf candidates. Open circles are confirmed foreground (<5 Mpc) galaxies taken from the LV Catalog. The footprint of the Dragonfly survey around M 101 is outlined by the rectangle. The circles indicate the virial radii of ≈260 kpc (for M 101; Merritt et al. 2014) for the three major galaxies (assuming the same virial radius for M 51 and M 63 as for M 101). |
| In the text | |
|
Fig. 2 SDSS r-band images of the 15 new M 101 group dwarf galaxy candidates. We note that dw1355+51 is at the edge of the CCD and is not centered in the stamp but offset to the right, and dw1255+40 is barely visible without a strong Gauss convolution. One side of an image corresponds to 80 arcsec or 2.7 kpc at the distance of 7 Mpc. North is to the right, east to the top. |
| In the text | |
|
Fig. 3 Results of our artificial galaxy detection test shown as an array of numbers indicating the detection efficiency in the surface brightness–absolute magnitude plane. A 10 means 100% detection and a 0 means no detection. The test array is divided into half-magnitude bins. The thin line corresponds to the estimated 70% completeness boundary; see text for the formula. |
| In the text | |
|
Fig. 4 Surface brightness profiles of all dwarf galaxy candidates in r and the best-fitting Sérsic profiles with 1σ confidence intervals. |
| In the text | |
|
Fig. 5 Our photometry for 19 known M 101 dwarf galaxies converted to B band versus the literature values taken from Bremnes et al. (1999). The line corresponds to unity. |
| In the text | |
|
Fig. 6 Left: μ0–MV relation for the photometric parameters of the known Local Group dwarfs (gray dots, McConnachie 2012) and the new candidates (red squares). Indicated by the thin line is the assumed completeness boundary (Sect. 3) at 7 Mpc, which is bracketed by lines corresponding to assumed distances of 5 Mpc and 10 Mpc to take care of the expected distance spread. Right: same data and color-coding, but for the log reff–MV relation. |
| In the text | |
|
Fig. 7 3D distribution, in supergalactic coordinates, of all galaxies with distance measurements in the surveyed M 101 group complex, centered at M 101. The red dots correspond to the major galaxies M 101, M 51, and M 63; the black dots indicate dwarf galaxies. The gray dots (shadows) appearing on the SGXSGZ– and SGYSGZ–walls are orthogonal projections. The best-fitting plane through the M 101 subgroup is shown as the gray plane and has a rms of only 46 kpc. The line of sight between the Milky Way and M 101 is indicated by the thick black line pointing downwards. |
| In the text | |
|
Fig. 8 M 101XM 101Z–projection (top) and M 101XM 101Y–projection (bottom) of known members and candidate members of the M 101 group complex in the M 101 reference system. The top panels essentially give an edge-on view of the complex, the bottom panels a face-on view. Red dots correspond to the three major galaxies M 101, M 51, and M 63; black dots indicate dwarf galaxies with distances. The thick red dotted line is the best-fitting (reference) plane lying in the M 101XM 101Y–plane. The left panels show the known members with 5% distance errors indicated by the short lines along the LoS. The right panels additionally give the possible positions of our new dwarf candidates and the candidates from the LV Catalog, in absence of distance measurements shown as long thin black lines again running along their LoS. |
| In the text | |
Current usage metrics show cumulative count of Article Views (full-text article views including HTML views, PDF and ePub downloads, according to the available data) and Abstracts Views on Vision4Press platform.
Data correspond to usage on the plateform after 2015. The current usage metrics is available 48-96 hours after online publication and is updated daily on week days.
Initial download of the metrics may take a while.