Fig. 6
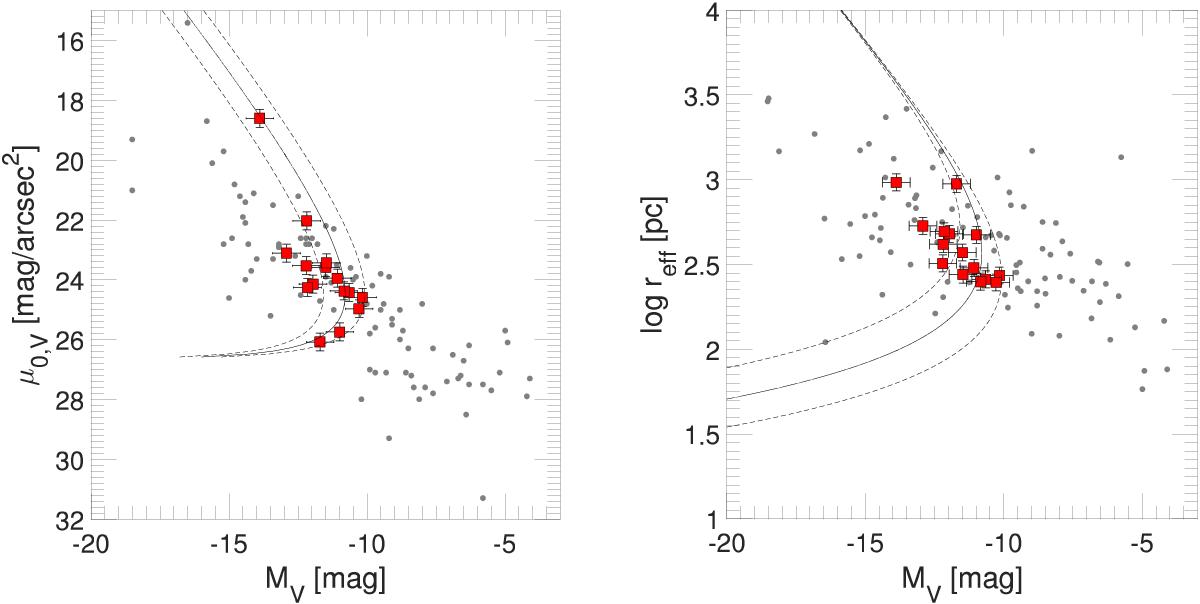
Left: μ0–MV relation for the photometric parameters of the known Local Group dwarfs (gray dots, McConnachie 2012) and the new candidates (red squares). Indicated by the thin line is the assumed completeness boundary (Sect. 3) at 7 Mpc, which is bracketed by lines corresponding to assumed distances of 5 Mpc and 10 Mpc to take care of the expected distance spread. Right: same data and color-coding, but for the log reff–MV relation.
Current usage metrics show cumulative count of Article Views (full-text article views including HTML views, PDF and ePub downloads, according to the available data) and Abstracts Views on Vision4Press platform.
Data correspond to usage on the plateform after 2015. The current usage metrics is available 48-96 hours after online publication and is updated daily on week days.
Initial download of the metrics may take a while.