| Issue |
A&A
Volume 678, October 2023
|
|
|---|---|---|
| Article Number | A16 | |
| Number of page(s) | 8 | |
| Section | Extragalactic astronomy | |
| DOI | https://doi.org/10.1051/0004-6361/202347085 | |
| Published online | 28 September 2023 | |
The M 101 galaxy group as a node in a nearby cosmic filament
1
Main Astronomical Observatory, National Academy of Sciences of Ukraine, Kiev 03143, Ukraine
2
Special Astrophysical Observatory of the Russian Academy of Sciences, N. Arkhyz, KChR 369167, Russia
e-mail: This email address is being protected from spambots. You need JavaScript enabled to view it.
Received:
1
June
2023
Accepted:
3
August
2023
Abstract
We performed a search for faint low-surface-brightness dwarf galaxies around the major spiral galaxy M 101 and in the large rectangular area within SGL = [30–80]° and SGB = [10–37]° spanning a chain of galaxies: M 63, M 51, M 101, and NGC 6503. We based our search on data from DESI Legacy Imaging Surveys. We discovered six new probable dwarf members of the complex. We present a list of 25 prospective members of the M 101 group and estimate the total mass and the total-mass-to-K-band-luminosity ratio of the group as (1.02 ± 0.42)×1012 M⊙ and (16.0 ± 6.5) M⊙/L⊙, respectively. We note that the average dark mass-to-luminosity ratio in the groups around M 63, M 51, and M 101 is (12 ± 4) M⊙/L⊙, which is almost an order of magnitude lower than the global cosmic ratio, (102 ± 5) M⊙/L⊙.
Key words: galaxies: dwarf / galaxies: groups: individual: M 101 / large-scale structure of Universe
© The Authors 2023
 Open Access article, published by EDP Sciences, under the terms of the Creative Commons Attribution License (https://creativecommons.org/licenses/by/4.0), which permits unrestricted use, distribution, and reproduction in any medium, provided the original work is properly cited.
This article is published in open access under the Subscribe to Open model. This email address is being protected from spambots. You need JavaScript enabled to view it. to support open access publication.
1. Introduction
Filaments, as extending elongated structures consisting of many galaxies, are among the main components of the large-scale structure of the Universe, together with the walls (sheets, pancakes), rich clusters, and cosmic voids (Joeveer et al. 1978; Bond et al. 1995; Cautun et al. 2014). The reality of cosmic filaments has been clearly confirmed by many N-body simulations made in the standard ΛCDM cosmological model (Aragon-Calvo et al. 2008; Chen et al. 2015; Libeskind et al. 2018, 2020). The typical linear dimensions, population, and the degree of “straightness” of the filaments remain somewhat unclear because they depend strongly on the criteria by which the cosmic filaments were isolated. The most rigorous definition of a filament as a one-dimensional (1D) sequence (i.e., a chain) of galaxies was proposed by Tempel et al. (2014). These authors published a catalog of filaments based on the Sloan Digital Sky Survey (SDSS) Data Release 8 (DR8; York et al. 2000; Aihara et al. 2011). The linear dimensions of these filaments are equal to ∼(3 − 60) Mpc. There is still no clear understanding of whether the space between the members of the filament is filled with neutral or hot gas and what proportion of dark-to-light matter exists in these structures.
The answer to these important questions can be obtained by studying the closest objects of this type. Within the Local Supercluster, the best-known filament is the Virgo Southern Extension (VSE; Tully & Shaya 1984), whose length reaches approximately 6 Mpc. Using the data on the distances and radial velocities of galaxies in VSE, Kashibadze et al. (2020) showed that the galaxies of this filament are moving towards the Virgo cluster center, replenishing its population. Around the Virgo cluster, Kim et al. (2016) and Castignani et al. (2022) marked a dozen other filament structures of similar length. However, the population and kinematics of these filaments have scarcely been investigated thus far.
Several linear structure candidates have been marked in the nearest Local volume limited by a distance of D ∼ 10 Mpc around the Milky Way. Jerjen et al. (1998), Karachentsev et al. (2003), and Pruzhinskaya et al. (2020) suggested that nearby galaxies in the Sculptor constellation, namely, NGC 55, NGC 300, NGC 247, NGC 253, NGC 24, NGC 45, and their satellites form a diffuse chain that is elongated in the radial direction in the distance interval from 2 to 7 Mpc. According to Sandage & Tammann (1974), the bright northern sky galaxies: IC 342, NGC 2403, M 81, NGC 4236, and their satellites can be members of a chain located approximately in the picture plane at a distance of 3–4 Mpc from us. Müller et al. (2017) and Karachentsev et al. (2020) suggested that the galaxy groups around massive spiral galaxies M 63 (NGC 5055), M 51 (NGC 5194), and M 101 (NGC 5457) are part of a filament that extends towards the Local Void, also possibly including the NGC 6503 galaxy.
Karachentsev et al. (2020) and Karachentsev & Kashibadze (2021) recently reviewed the structure and kinematics of the galaxy groups around M 63 and M 51. In this work, we discuss the new data on the M 101 group population in the context of its membership in the M 63/M 51/M 101 filament. The proximity of this chain of groups allows one to discern a clearer portrait of the cosmic filament, since it is easier to measure distances to nearby galaxies and exclude projected foreground and background objects.
The paper is outlined as follows. We begin in Sect. 2 by describing the search for prospective new low-surface-brightness dwarf galaxies and their photometry. Using the radial velocities and projected separations for eight M 101 group galaxies, we estimate the total (orbital) mass of the group. In Sect. 3, we discuss the structure and population of a chain of galaxy groups, which includes galaxies M 101, M 51, M 63, and possibly NGC 6503, together with their satellites. We calculate the dark-to-luminous matter mass ratio in the filament groups, which is almost an order of magnitude lower than the global cosmic ratio. In Sect. 4, we outline our primary results, focusing on the general size of the galaxy filament. We also note that the environment of the filament is extremely poor, partly belonging to the Local Void.
In Table A.1, we present a list of 62 suggested members of the filament as well as ten galaxies in the immediate environment of the filament. In all calculations we use the Hubble parameter H0 = 73 km s−1 Mpc−1.
2. Search for new dwarf galaxies in the M 101 group
For a long time, it was believed that only a few late-type dwarf galaxies, namely, NGC 5474, NGC 5477, NGC 5585, and Holmberg IV are associated with the massive spiral galaxy M 101. In the last decade, searches have been undertaken for fainter satellites of M 101. Merritt et al. (2014) and Karachentsev et al. (2015) performed a survey of the surroundings of M 101 using long exposures on small telescopes with a large field of view. As a result, ten low-surface-brightness M 101 satellite candidates were discovered. Bennet et al. (2017) repeated the survey of the virial zone around M 101, obtaining deeper images of this region with the 3.6-m CFHT telescope. In these images, carried out with a high resolution, they detected 38 dwarf spheroidal galaxies with apparent magnitudes ranging between 19 and 21 mag in the B-band and angular diameters ∼(10 − 20)″. However, it later turned out that most of them are associated with distant galaxy groups NGC 5422 and NGC 5485 that are located behind M 101 at a distance of D ≃ 29 Mpc (Karachentsev & Makarova 2019). Müller et al. (2017) undertook a search for dwarf galaxies outside the virial zone of M 101 using the data of SDSS DR 11-12 (Alam et al. 2015). As a result, they found six new M 101 satellite candidates.
F606W- and F814W-band images were obtained with the Hubble Space Telescope (HST) equipped with the ACS camera for two dozen suggested satellites of M 101 (programs GO 13682, PI van Dokkum and GO 14796, PI Crnojevich). Based on these images, distances to a number of dwarfs resolved into stars were determined by the luminosity of the tip of the red giant branch (TRGB; Merritt et al. 2016; Danieli et al. 2017; Karachentsev & Makarova 2019). Using the images obtained with the CFHT, Carlsten et al. (2022) performed surface photometry of many dwarf galaxies in the M 101 virial zone and determined their distances by the surface brightness fluctuation (sbf) method.
The galaxy group around M 101 is located in the area of DESI Legacy Imaging Surveys (Dey et al. 2019). This survey is deeper than the SDSS sky survey by about 1.5 mag. We use the DESI Legacy Imaging Surveys data to search for new dwarf satellites of M 101. Our search region covered an area with a radius of 6° around M 101, which is almost four times the virial radius of the group. A particular emphasis was placed on finding objects of low and very low surface brightness. As a result, we found five candidates for M 101 peripheral satellites. Their data are presented in Table 1, where the columns give: the galaxy name; equatorial coordinates in degrees; supergalactic coordinates in degrees; the maximum angular diameter of the galaxy visible in the DESI Legacy Imaging Surveys in arc minutes; the apparent axis ratio; morphological type; and the total g and r band mag and the total B mag estimated via the relation B = g + 0.313(g − r)+0.227, recommended by Lupton1. The last row of Table 1 contains data on a new dwarf galaxy we found slightly away from the M 63 and M 51 groups.
New M 101 satellite candidates.
The apparent g and r magnitudes were obtained from surface photometry of the galaxies in the DESI Legacy Imaging Surveys DR 9. We measured the g- and r-band fluxes of these galaxies using the standard methods of processing in the ESO-MIDAS software package. Foreground stars were removed from the frames by fitting a second-degree surface in a circular pixel area. The sky background in the image was approximated by a tilted plane, created from a 2D polynomial using the least-squares method (fit-flat sky). The mean uncertainty introduced by the inaccuracy of the sky background determination is ≤0.12 mag and primarily caused by the background variations across the frame. Part of our sample is comprised of galaxies of extremely low surface brightness. The objects are characterized by an irregular, clumpy structure. For this reason, we did not approximate the galaxies by ellipses but used circular apertures. The center of each galaxy was determined interactively. To measure the g- and r-band fluxes, integrated photometry was performed in increasing circular apertures from a preselected center to the faint outskirts of the galaxies. The total flux was then estimated as the asymptotic value of the obtained radial growth curve. The uncertainties of the total flux determination were 0.06 mag in the g- and 0.08 mag in the r-band. We obtained the apparent magnitudes according to the relation m = 22.5 − 2.5 log(flux)2.
The mosaic of images of these galaxies, taken from the DESI Legacy Imaging Surveys, is given in Fig. 1. One side of an image corresponds to 2′. North is on top, east is on the left. Below, we note some features of the discovered galaxies.
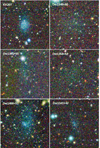 |
Fig. 1. Images of 6 new dwarf galaxies from the DESI Legacy Imaging Surveys found in the M 63/M 51/M 101/NGC 6503 filament. Each image size is 2′×2′. North is to the top, East is to the left. |
KK 207. This dwarf galaxy of irregular type was found earlier (Karachentseva & Karachentsev 1998) in the Second Palomar Observatory Sky Survey, but not assigned to the M 101 group. Its structure seems granulated in the DESI Legacy Imaging Surveys. The galaxy is also detected in the GALEX survey (Martin et al. 2005) and has the apparent magnitude of m(FUV) = 20.68 mag.
Dw 1348+60. A dwarf galaxy of spheroidal (dSph) or transition (Tr) type of very low surface brightness. It is probably a companion of a distant galaxy NGC 5322 with VLG = 1932 km s−1 and D = 31.9 Mpc (sbf), which has a number of other small dSph satellites. However, at a distance of 31.9 Mpc, the Dw 1348+60 galaxy would have a linear diameter of 8 kpc, which is quite unusual for a dwarf galaxy with such a low surface brightness. On the other hand, Dw 1348+60 is located on the far outskirts of the M 101 group, which raises the question of the cause of the suppressed star formation in this galaxy.
Dw 1351+50. A dwarf galaxy of irregular- or transition-type of very low surface brightness, which is barely visible in the SDSS survey.
Dw 1358+52. This dwarf spheroidal galaxy of very low surface brightness is located in the survey zone of Carlsten et al. (2022) but was not noticed by them.
Dw 1409+51. This is a low-surface-brightness dwarf irregular galaxy with a blue central knot of m(NUV) = 20.09 mag in GALEX. A distant Sd-galaxy UGC 9050 lies at 8′ to the west of it. This neighboring galaxy has a heliocentric velocity of Vh = 2001 km s−1 and a distance estimate of 32 Mpc. Both galaxies can form a physical pair. However, in this case, the linear diameter of Dw 1409+51 could reach about 16 kpc, which is atypical for such a dwarf object3.
Dw 1341+42. Isolated dwarf irregular galaxy with a slightly granulated structure. It has a GALEX magnitude of m(NUV) = 22.14.
At present, the list of M 101 group members includes 25 candidates. They are summarized in Table 2. Its columns contain: (1) the galaxy name; (2) equatorial coordinates; (3) distance to the galaxy in Mpc; (4) method used to estimate the galaxy distance: “TRGB” by the luminosity of the tip of the red giant branch, “sbf” by the surface brightness fluctuations, “mem” by the supposed group membership; (5) radial velocity of the galaxy in km s−1 relative to the centroid of the Local Group; (6) logarithm of the integral K-band luminosity of the galaxy, in units of the luminosity of the Sun, taken from the Updated Nearby Galaxy Catalog (UNGC; Karachentsev et al. 2013); (7) morphological type taken from UNGC; (8) projected separation of the galaxy from M 101 in kpc assuming that all objects are at the same distance as M 101; (9) link to the source of the distance data; (10) orbital estimate of the total mass of the group by projected separation, Rp, and radial velocity difference, ΔV, of each satellite relative to M 101: Morb = (16/π × G)RpΔV2 (Karachentsev & Kashibadze 2021), where G is the gravitational constant and mass is expressed in units of M⊙. We also included the intergalactic hydrogen cloud GBT 1355+54 found by Mihos et al. (2012) in the list of group members.
Galaxies associated with M 101.
According to these data, the average value of the orbital estimate of the total mass of the M 101 group is ⟨Morb⟩=(1.05 ± 0.42)×1012 M⊙. With the integral luminosity of the group ΣLK = 6.56 × 10¹⁰ L⊙, the total mass-to-luminosity ratio, ⟨Morb⟩/ΣLK, is equal to (16.0 ± 6.5) M⊙/L⊙. This quantity is typical for groups where a late-type spiral galaxy dominates.
It should be noted that the membership of some peripheral galaxies in the M 101 group is questionable. Thus, the dwarf galaxies of very low surface brightness: Dw 1348+60 and Dw 1409+51 may be satellites of distant galaxies NGC 5322 and UGC 9050 at a distance of about 32 Mpc. Additionally, dwarf galaxies dw 1446+58 and dw 1416+57, found by Müller et al. (2017), appear to be background galaxies in the DESI Legacy Imaging Surveys. These four galaxies do not have measured radial velocities and were not included in the orbital mass estimation.
3. Chain of groups M 63, M 51, M 101, and NGC 6503
The basic parameters of these four groups are presented in Table 3, whose columns contain: (1) the main galaxy name; (2) its supergalactic coordinates; (3, 4) distance (Mpc) and radial velocity (km s−1) of the host galaxy; (5) number of group member candidates; (6) number of satellites with measured radial velocity; (7) the total (orbital) mass in units of M⊙; (8) virial radius of the group (kpc) estimated from the Tully (2015) relation (Rvir/215 kpc) = (MT/1012 M⊙)1/3; (9) the total mass-to-luminosity ratio. For the galaxy groups M 63 and M 51, their mass estimates are taken from Karachentsev & Kashibadze (2021) and for NGC 6503, the mass estimate is made by only one satellite (Karachentsev et al. 2022).
Galaxy groups in the M 101 filament.
As can be seen from these data, the NGC 6503 galaxy with its satellite KK 242 is quite far from the other members of the filament. Nevertheless, its distance and radial velocity fit well with the general relation between VLG and D (see Fig. 2). The linear regression in Fig. 2 passes through each of the 5% distance error intervals for all the galaxies. The slope of the regression line in Fig. 2 formally corresponds to the Hubble parameter H = (95 ± 7) km s−1 Mpc−1. The large value of the Hubble parameter is explained via the numerical action methods model (Shaya et al. 2017), which describes the local velocity field taking into account the expansion of the Local Void and the Virgo-centric flow. According to the “distance–velocity” diagram in the Extragalactic Distance Database4 (Kourkchi et al. 2020), the M 63 galaxy at the far end of the filament has a peculiar radial velocity of −50 km s−1 relative to the unperturbed Hubble flow with H = 73 km s−1 Mpc−1; whereas the NGC 6503 galaxy at the close end of the chain has a peculiar velocity of −115 km s−1. This difference in peculiar velocities results in a steeper observed slope, H = 96 km s−1 Mpc−1 instead of 73 km s−1 Mpc−1.
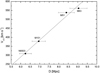 |
Fig. 2. Relation between the radial velocities and distances of the principal galaxies in the M 101 filament. The horizontal bars correspond to 5% galaxy distance errors. The solid line indicates a linear regression with a slope of H = (95 ± 7) km s−1 Mpc−1. |
The general shape of the chain of considered groups in supergalactic coordinates is shown in Fig. 3. The early-type and late-type galaxies are depicted by red and blue symbols, respectively. The host galaxies in groups are indicated by squares. The small and large circles around them correspond to the virial radius of the group, Rvir, and the radius of the zero-velocity sphere, R0 ≃ 3.5 Rvir, which separates the volume of the group from the general expanding cosmic space. The six new dwarf galaxies found by us are indicated by asterisks. They can be identified by their supergalactic coordinates presented in Table 1.
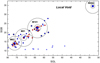 |
Fig. 3. Survey area of about 1200 square degrees in the M 63, M 51, M 101, and NGC 6503 filament region. The filled circles show the suggested satellites of the principal galaxies in the chain of groups, shown as squares. The crosses show other galaxies with distances from 5 to 10 Mpc that are not associated with the filament. The dwarf galaxies discovered by us are shown by asterisks. The red symbols correspond to early-type galaxies (T < 0), while the blue symbols represent late-type ones. The small and large circles around the principal galaxies indicate their virial radius, Rvir, and the zero-velocity radius, R0. |
In addition to the alleged members of specified groups, we use crosses in Fig. 3 to show the other galaxies from the UNGC catalog with their distance estimates in the 5–10 Mpc interval. Almost all of them (nine out of ten) lie near the Local supergalactic plane (SGB < 15°).
The general summary of the data on 72 galaxies in the SGL = [30° −80° ], SGB = [10° −37° ] region with the distance estimates D = (5 − 10) Mpc is presented in Table A.1. The columns of this table contain: (1) the galaxy name; (2,3) supergalactic coordinates in degrees; (4) K-band integral luminosity in solar luminosity units taken from UNGC; (5) morphological type from UNGC in de Vaucouleurs digital scale; (6) radial velocity relative to the Local group centroid, in km s−1; (7) distance in Mpc; (8) method used to estimate the distance; here “SN” denotes the distance estimated from supernovae luminosity, “TF” is the estimate by the Tully–Fisher relation between the galaxy rotation amplitude and luminosity, “NAM” is a kinematic estimate taking into account the local velocity field (Shaya et al. 2017), and “txt” is a rough estimate by galaxy texture. The galaxies in each group are ranked according to their SGL. In Tables A.1 and 2, we distinguish between the dwarf galaxies that we discovered and those known from the literature as “Dw” and “dw”, respectively.
We examined the entire sky region outlined in Fig. 3 with a total area of about 1200 square degrees in the DESI Legacy Imaging Surveys and found only one dwarf galaxy with a suggested distance of D < 10 Mpc. The galaxy is shown in the last row of Table 1. This fact indicates that the main body of filament M 63, M 51, M 101, and NGC 6503 is indeed surrounded by an almost empty space, being part of the Local Void, which extends towards the northern supergalactic pole.
The M 63 group, as the side of the filament farthest from us, is the closest one to the Local Sheet plane. We did not find any massive group in the Local Sheet itself which could serve as a southward continuation of the filament under consideration.
As is evident from Fig. 3, the zones of gravitational influence of massive spiral galaxies M 63, M 51, and M 101, outlined by the radius R0, intersect with each other. This means that in the future these groups will merge into a single system. The NGC 6503 galaxy with its companion stand apart from the main body of the filament.
The dwarf spheroidal galaxies without obvious sings of star formation are located inside the R0 zones, demonstrating the well-known segregation effect of the early type galaxies (T < 0) from the late type ones in the dependence on the density of the environment.
As follows from the data in Table 3, the average weighted total mass-to-K-band luminosity ratio for the M 63, M 51, and M 101 groups is (12 ± 4) M⊙/L⊙. According to Driver et al. (2012), the average global density of the K-band luminosity is equal to (4.3 ± 0.2)×108 L⊙ Mpc−3 at H0 = 73 km s−1 Mpc−1. At the critical cosmic density 1.46 × 10¹¹ M⊙ Mpc−3 and for the parameter Ωm = 0.3, the dark-matter-to-K-luminosity global density ratio is (102 ± 5) M⊙/L⊙. Therefore, the ratio of dark-to-luminous matter in the M 63/M 51/M 101 filament groups turns out to be 8.5 times lower than the global cosmic ratio. In order for this chain of groups to not look like a “dent” in the general cosmological field, it is necessary to assume that the bulk of dark matter of the filament is distributed beyond the virial radii of these three groups. In such a case, the estimates of the virial radius from Tully’s relation would be rather uncertain. The reason for the low dark-to-stellar mass ratio in the groups under consideration remains unclear to us. Possibly, the dark mass deficit of the filament groups can be caused by their proximity to the Local Void. A special deep survey of this filament and its vicinity in the 21 cm line could reveal new small dwarfs and HI- clouds in the system, thereby increasing the statistical reliability of the estimates of the total mass of the groups.
4. Concluding remarks on the filament
Extended galaxy chains, that is, filaments, are a common configuration in the large-scale structure of the Universe. According to Tempel et al. (2014), about 35–40% of all galaxies are part of cosmic filaments. Here, we consider one of their nearest representatives, residing inside the Local Volume. The main elements of this filament are the groups around massive spiral galaxies M 63, M 51, and M 101, which are in contact with each other. The spiral galaxy NGC 6503 with its satellite KK 242 may serve as a continuation of this chain. The radial velocities of M 63, M 51, M 101, and NGC 6503, as well as their distances from the observer, change smoothly along the body of the filament. The far end of this chain at a distance of 9 Mpc is adjacent to the Local Sheet plane, while the near end at 6 Mpc is embedded in the Local Void volume. The total filament length, taking into account NGC 6503, is ∼60°, or 8 Mpc.
Using the data of DESI Legacy Imaging Surveys, we have undertaken searches for new dwarf galaxies in a wide 50° ×27° region, shown in Fig. 3. In the M 101 group itself, five new candidates for satellites of the host galaxy were discovered and only one dwarf galaxy was found outside the filament body. The list of 72 galaxies in this region with distance estimates ranging from 5 Mpc to 10 Mpc is presented in Table A.1. Of these, only ten galaxies are located outside the filament body, and most of them, namely, nine out of the ten, have a low supergalactic latitude, tending towards the Local Sheet.
The proximity of this cosmic filament made it possible for the first time to estimate the ratio of dark-to-light matter in it, MT/LK. The average weighted ratio ⟨MT/LK⟩≃(12 ± 4) M⊙/L⊙ for the filament groups turned out to be almost an order of magnitude lower than the global ratio (102 ± 5) M⊙/L⊙ in the Standard Model ΛCDM. The reason for this paradox merits a careful analysis.
Despite great efforts made in the last quarter of the century to measure accurate distances with the Hubble Space Telescope, more than 60% of galaxies in the zone of the nearest filament (see Table A.1) do not yet have reliable distance estimates. Evidently, this gap needs to be filled to improve our understanding of the structure of the cosmic filament closest to us.
In a recent paper, Fielder et al. (2023) studied Dw 1409+51 = UGC 9050−Dw1 with the Hubble Space Telescope and the Very Large Array. They found the object to be a background ultra-diffuse galaxy with a heliocentric velocity of 1952 km s−1.
Acknowledgments
We are grateful to the anonymous referee for a prompt report that helped us improve the manuscript. This work has made use of the DESI Legacy Imaging Surveys (https://www.legacysurvey.org/), the Sloan Digital Sky Survey (SDSS, https://www.sdss3.org/), the NASA/IPAC Extragalactic Database (https://ned.ipac.caltech.edu/) (NED), The Galaxy Evolution Explorer (GALEX, http://www.galex.caltech.edu/index.html), HyperLeda (http://leda.univ-lyon1.fr/), and the revised version of the Local Volume galaxy database (http://www.sao.ru/lv/lvgdb). The Local Volume galaxies database has been updated within the framework of grant 075-15-2022-262 (13.MNPMU.21.0003) of the Ministry of Science and Higher Education of the Russian Federation.
References
- Aihara, H., Allende, P. C., An, D., et al. 2011, ApJS, 193, 29 [NASA ADS] [CrossRef] [Google Scholar]
- Alam, S., Albareti, F. D., Allende, P. C., et al. 2015, ApJS, 219, 12 [NASA ADS] [CrossRef] [Google Scholar]
- Anand, G. S., Rizzi, L., Tully, R. B., et al. 2021, AJ, 162, 80 [CrossRef] [Google Scholar]
- Aragon-Calvo, M. A., Platen, E., van de Weygaert, R., & Szalay, A. S. 2008, ApJ, 723, 364 [Google Scholar]
- Bennet, P., Sand, D. J., Crnojevich, D., et al. 2017, ApJ, 805, 109 [NASA ADS] [CrossRef] [Google Scholar]
- Bond, J. R., Kofman, L., & Pogosyan, D. 1995, Nature, 380, 603 [Google Scholar]
- Carlsten, S. G., Greene, J. E., & Beaton, R. L. 2022, ApJ, 933, 47 [CrossRef] [Google Scholar]
- Castignani, G., Vulcani, B., Finn, R. A., et al. 2022, ApJS, 259, 43 [NASA ADS] [CrossRef] [Google Scholar]
- Cautun, M., van de Weygaert, R., Jones, B. J. T., & Frenk, C. S. 2014, MNRAS, 441, 2923 [Google Scholar]
- Chen, Y. C., Ho, S., Tenneti, A., et al. 2015, MNRAS, 454, 3341 [NASA ADS] [CrossRef] [Google Scholar]
- Danieli, S., van Dokkum, P., Merritt, A., et al. 2017, ApJ, 837, 136 [NASA ADS] [CrossRef] [Google Scholar]
- Dey, A., Schlegel, D. J., Lang, D., et al. 2019, AJ, 157, 168 [Google Scholar]
- Driver, S. P., Robotham, A. S. G., Kelvin, L., et al. 2012, MNRAS, 427, 3244 [NASA ADS] [CrossRef] [Google Scholar]
- Fielder, C. E., Jones, M. G., Sand, D. J., et al. 2023, ApJ, 954, L39 [NASA ADS] [CrossRef] [Google Scholar]
- Jerjen, H., Freeman, K. C., & Binggeli, B. 1998, AJ, 116, 2873 [NASA ADS] [CrossRef] [Google Scholar]
- Joeveer, M., Einasto, J., & Tago, E. 1978, MNRAS, 185, 357 [NASA ADS] [CrossRef] [Google Scholar]
- Karachentseva, V. E., & Karachentsev, I. D. 1998, A&AS, 127, 409 [NASA ADS] [CrossRef] [EDP Sciences] [Google Scholar]
- Karachentsev, I., & Kashibadze, O. 2021, Astron. Nachr., 342, 999 [NASA ADS] [CrossRef] [Google Scholar]
- Karachentsev, I. D., & Makarova, L. N. 2019, Astrophysics, 62, 29 [Google Scholar]
- Karachentsev, I. D., Grebel, E. K., Sharina, M. E., et al. 2003, A&A, 404, 93 [CrossRef] [EDP Sciences] [Google Scholar]
- Karachentsev, I. D., Makarov, D. I., & Kaisina, E. I. 2013, AJ, 145, 101 [Google Scholar]
- Karachentsev, I. D., Riepe, P., Zilch, T., et al. 2015, Astron. Bull., 70, 379 [CrossRef] [Google Scholar]
- Karachentsev, I. D., Neyer, F., Spani, R., & Zilch, T. 2020, Astr. Nachr., 341, 1037 [NASA ADS] [CrossRef] [Google Scholar]
- Karachentsev, I. D., Cannon, J. M., Fuson, J., et al. 2022, AJ, 163, 51 [NASA ADS] [CrossRef] [Google Scholar]
- Kashibadze, O. G., Karachentsev, I. D., & Karachentseva, V. E. 2020, A&A, 635, A135 [NASA ADS] [CrossRef] [EDP Sciences] [Google Scholar]
- Kim, S., Rey, S.-C., Bureau, M., et al. 2016, ApJ, 833, 207 [NASA ADS] [CrossRef] [Google Scholar]
- Kourkchi, E., Courtois, H. M., Graziani, R., et al. 2020, AJ, 159, 67 [NASA ADS] [CrossRef] [Google Scholar]
- Libeskind, N. I., van de Weygaert, R., Cautun, M., et al. 2018, MNRAS, 473, 1195 [NASA ADS] [CrossRef] [Google Scholar]
- Libeskind, N. I., Carlesi, E., Grand, R. J., et al. 2020, MNRAS, 498, 2968 [NASA ADS] [CrossRef] [Google Scholar]
- Martin, D. C., Fanson, J., Schiminovich, D., et al. 2005, ApJ, 619, L1 [Google Scholar]
- Merritt, A., van Dokkum, P., & Abraham, R. 2014, ApJ, 787, L37 [NASA ADS] [CrossRef] [Google Scholar]
- Merritt, A., van Dokkum, P., Danieli, S., et al. 2016, ApJ, 833, 168 [NASA ADS] [CrossRef] [Google Scholar]
- Mihos, J. C., Keating, K., Holley-Bockelmann, K., et al. 2012, ApJ, 761, 186 [NASA ADS] [CrossRef] [Google Scholar]
- Müller, O., Scalera, R., Binggeli, B., & Jerjen, H. 2017, A&A, 602, A119 [NASA ADS] [CrossRef] [EDP Sciences] [Google Scholar]
- Pruzhinskaya, M. V., Chernin, A. D., & Karachentsev, I. D. 2020, Ap&SS, 365, 120 [NASA ADS] [CrossRef] [Google Scholar]
- Sandage, A., & Tammann, G. A. 1974, ApJ, 191, 603 [NASA ADS] [CrossRef] [Google Scholar]
- Shaya, E. L., Tully, R. B., Hoffman, Y., & Pomarede, D. 2017, ApJ, 850, 207 [NASA ADS] [CrossRef] [Google Scholar]
- Tempel, E., Stoica, R. S., Martinez, V. J., et al. 2014, MNRAS, 438, 3465 [CrossRef] [Google Scholar]
- Tully, R. B. 2015, AJ, 149, 54 [NASA ADS] [CrossRef] [Google Scholar]
- Tully, R. B., & Shaya, E. J. 1984, ApJ, 281, 31 [NASA ADS] [CrossRef] [Google Scholar]
- York, D. G., Adelman, J., Anderson, J. E., Jr, et al. 2000, AJ, 120, 1579 [Google Scholar]
Appendix A: M101 filament of galaxies
List of 72 galaxies in the inspected region with distance estimates from 5 Mpc to 10 Mpc
All Tables
List of 72 galaxies in the inspected region with distance estimates from 5 Mpc to 10 Mpc
All Figures
|
Fig. 1. Images of 6 new dwarf galaxies from the DESI Legacy Imaging Surveys found in the M 63/M 51/M 101/NGC 6503 filament. Each image size is 2′×2′. North is to the top, East is to the left. |
| In the text | |
|
Fig. 2. Relation between the radial velocities and distances of the principal galaxies in the M 101 filament. The horizontal bars correspond to 5% galaxy distance errors. The solid line indicates a linear regression with a slope of H = (95 ± 7) km s−1 Mpc−1. |
| In the text | |
|
Fig. 3. Survey area of about 1200 square degrees in the M 63, M 51, M 101, and NGC 6503 filament region. The filled circles show the suggested satellites of the principal galaxies in the chain of groups, shown as squares. The crosses show other galaxies with distances from 5 to 10 Mpc that are not associated with the filament. The dwarf galaxies discovered by us are shown by asterisks. The red symbols correspond to early-type galaxies (T < 0), while the blue symbols represent late-type ones. The small and large circles around the principal galaxies indicate their virial radius, Rvir, and the zero-velocity radius, R0. |
| In the text | |
Current usage metrics show cumulative count of Article Views (full-text article views including HTML views, PDF and ePub downloads, according to the available data) and Abstracts Views on Vision4Press platform.
Data correspond to usage on the plateform after 2015. The current usage metrics is available 48-96 hours after online publication and is updated daily on week days.
Initial download of the metrics may take a while.