Fig. 7
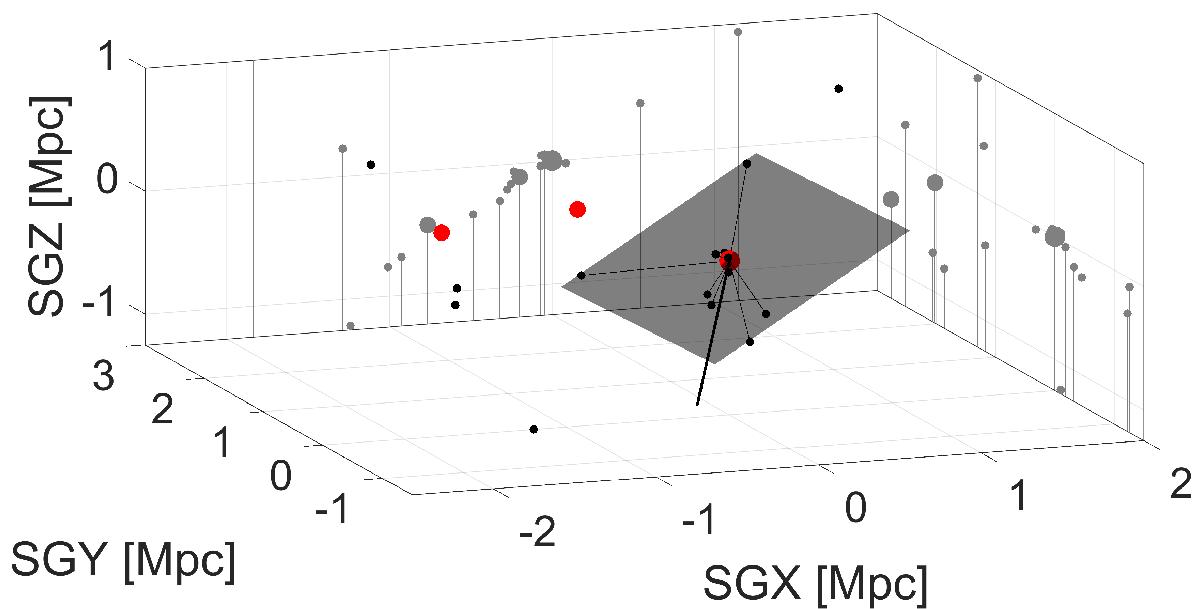
3D distribution, in supergalactic coordinates, of all galaxies with distance measurements in the surveyed M 101 group complex, centered at M 101. The red dots correspond to the major galaxies M 101, M 51, and M 63; the black dots indicate dwarf galaxies. The gray dots (shadows) appearing on the SGXSGZ– and SGYSGZ–walls are orthogonal projections. The best-fitting plane through the M 101 subgroup is shown as the gray plane and has a rms of only 46 kpc. The line of sight between the Milky Way and M 101 is indicated by the thick black line pointing downwards.
Current usage metrics show cumulative count of Article Views (full-text article views including HTML views, PDF and ePub downloads, according to the available data) and Abstracts Views on Vision4Press platform.
Data correspond to usage on the plateform after 2015. The current usage metrics is available 48-96 hours after online publication and is updated daily on week days.
Initial download of the metrics may take a while.