| Issue |
A&A
Volume 601, May 2017
|
|
|---|---|---|
| Article Number | L9 | |
| Number of page(s) | 9 | |
| Section | Letters | |
| DOI | https://doi.org/10.1051/0004-6361/201730716 | |
| Published online | 24 May 2017 | |
Spatially resolved images of reactive ions in the Orion Bar⋆,⋆⋆
1 Instituto de Ciencias de Materiales de Madrid (CSIC), 28049 Madrid, Spain
e-mail: This email address is being protected from spambots. You need JavaScript enabled to view it.
2 Institut de Radioastronomie Millimétrique, 38406 Saint-Martin d’Hères, France
3 LERMA, Obs. de Paris, PSL Research University, CNRS, Sorbonne Universiteés, 75005, UPMC Univ. Paris 06, ENS, France
4 Chalmers University of Technology, Onsala Space Observatory, 43992 Onsala, Sweden
5 OASU/LAB-UMR5804, CNRS, Université Bordeaux, 33615 Pessac, France
6 Observatorio Astronómico Nacional (IGN). Apartado 112, 28803 Alcalá de Henares, Spain
Received: 1 March 2017
Accepted: 21 April 2017
Abstract
We report high angular resolution (4.9′′ × 3.0′′) images of reactive ions SH+, HOC+, and SO+ toward the Orion Bar photodissociation region (PDR). We used ALMA-ACA to map several rotational lines at 0.8 mm, complemented with multi-line observations obtained with the IRAM 30 m telescope. The SH+ and HOC+ emission is restricted to a narrow layer of 2′′- to 10′′-width (≈800 to 4000 AU depending on the assumed PDR geometry) that follows the vibrationally excited H2* emission. Both ions efficiently form very close to the H/H2 transition zone, at a depth of AV ≲ 1 mag into the neutral cloud, where abundant C+, S2* coexist. SO+ peaks slightly deeper into the cloud. The observed ions have low rotational temperatures (Trot ≈ 10−30 K ≪ Tk) and narrow line-widths (~2−3 km s-1), a factor of ≃2 narrower that those of the lighter reactive ion CH+. This is consistent with the higher reactivity and faster radiative pumping rates of CH+ compared to the heavier ions, which are driven relatively more quickly toward smaller velocity dispersion by elastic collisions and toward lower Trot by inelastic collisions. We estimate column densities and average physical conditions from an excitation model (n(H2) ≈ 105−106 cm-3, n(e−) ≈ 10 cm-3, and Tk ≈ 200 K). Regardless of the excitation details, SH+ and HOC+ clearly trace the most exposed layers of the UV-irradiated molecular cloud surface, whereas SO+ arises from slightly more shielded layers.
Key words: astrochemistry / line: identification / ISM: clouds / (ISM:) photon-dominated region (PDR)
This paper makes use of the following ALMA data: ADS/JAO.ALMA#2012.1.00352.S. ALMA is a partnership of ESO (representing its member states), NSF (USA), and NINS (Japan), together with NRC (Canada), and NSC and ASIAA (Taiwan), in cooperation with the Republic of Chile. The Joint ALMA Observatory is operated by ESO, AUI/NRAO, and NAOJ.
Includes IRAM 30 m telescope observations. IRAM is supported by INSU/CNRS (France), MPG (Germany), and IGN (Spain).
© ESO, 2017
1. Introduction
Reactive ions are transient species for which the timescale of reactive collisions with H2, H, or e− (leading to a chemical reaction, and thus molecule destruction) is comparable to, or shorter than, that of inelastic collisions (Black 1998; Nagy et al. 2013; Godard & Cernicharo 2013). The formation of reactive ions such as CH+ and SH+ depends on the availability of C+ and S+ (i.e., of UV photons and thus high ionization fractions xe = n(e−) /nH), and on the presence of excited H2 (either UV-pumped or hot and thermally excited). This allows overcoming the high endothermicity (and sometimes energy barrier) of some of the key initiating chemical reactions (e.g., Gerin et al. 2016). The reaction C+ + H2(v) → CH+ + H, for example, is endothermic by ΔE/k ≃ 4300 K if v = 0, but exothermic and fast for v ≥ 1 (Hierl et al. 1997; Agúndez et al. 2010). Despite their short lifetimes, reactive ions can be detected and used to probe energetic processes in irradiated, circumstellar (e.g., Cernicharo et al. 1997), interstellar (e.g., Fuente et al. 2003), or protostellar (e.g., Benz et al. 2016) gas.
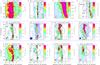 |
Fig. 1 ALMA-ACA and complementary images of the Bar. All images have been rotated to bring the FUV illuminating direction roughly in the horizontal direction (from the right). The circles indicate the position of our IRAM 30 m line survey, with beams of ≈8′′ (≈30′′) at 1 mm (3 mm). The upper row shows images of b) the H2v = 1−0S(1) line at 2.12 μm, delineating the DF (Walmsley et al. 2000); c) the Spitzer 8 μm emission produced mainly by PAHs (Megeath et al. 2012), and d) the fluorescent O i line at 1.32 μm at the H ii/PDR boundary (Walmsley et al. 2000). The blue contours in e) and f) represent the CH+ 119.8 μm (≈9′′ resolution) and OH 84.6 μm (≈6′′) lines mapped by Herschel (Parikka et al. 2017). |
CO+ and HOC+ (the metastable isomer of HCO+) have been detected in low angular resolution observations of UV-irradiated clouds near massive stars (Stoerzer et al. 1995; Apponi et al. 1999; Fuente et al. 2003). They are predicted to form close to the H/H2 transition zone, the dissociation front (DF), by high-temperature reactions of C+ with OH and H2O, respectively (e.g., Sternberg & Dalgarno 1995). HOC+ also forms by the reaction CO+ + H2→ HOC+ + H; thus, CO+ and HOC+ abundances are likely related (Smith et al. 2002). In photodissociation regions (PDRs), SO+ is predicted to form primarily via the reaction S+ + OH → SO+ + H (e.g., Turner 1996). These ion-neutral reactions leading to CO+, HOC+ and SO+ are highly exothermic.
Herschel allowed the detection of OH, CH+, and SH+ emission toward dense PDRs (Goicoechea et al. 2011; Nagy et al. 2013, 2017; Parikka et al. 2017). Unfortunately, the limited size of the space telescope did not permit us to resolve the ΔAV ≲ 1 mag extent of the DF (a few arcsec for the closest PDRs). Therefore, the true spatial distribution of the reactive ions emission is mostly unknown. Unlike CH+, rotational lines of SH+ can be observed from the ground (Müller et al. 2014). Here we report the first interferometric images of SH+, HOC+, and SO+.
The Orion Bar is a dense PDR (Hollenbach & Tielens 1999) illuminated by a far-UV (FUV) (6 eV<E<13.6 eV) field of a few 104 times the mean interstellar radiation field. Because of its proximity (~414 pc, Menten et al. 2007) and nearly edge-on orientation, the Bar is a template to investigate the dynamics and chemistry in strongly FUV-irradiated gas (e.g., Pellegrini et al. 2009; Cuadrado et al. 2015; Goicoechea et al. 2016).
2. Observations and data reduction
The interferometric images were taken with the 7 m antennas of the Atacama Compact Array (ACA), Chile. The observations consisted of a 10-pointing mosaic centered at α(2000) = 5h35m20.6s; δ(2000) = −05°25′20′′. The total field-of-view (FoV) is ~50′′ × 50′′. Target line frequencies lie in the ~345-358 GHz range (Table A.1). Lines were observed with correlators providing ~500 kHz resolution over a 937.5 MHz bandwidth. The ALMA-ACA observation time was ~6 h. In order to recover the extended emission filtered out by the interferometer, we used fully sampled single-dish maps as zero- and short-spacings. The required high-sensitivity maps were obtained using the ALMA total-power 12 m antennas (~19′′ resolution). We used the GILDAS/MAPPING software to create the short-spacing visibilities not sampled by ALMA-ACA. These visibilities were merged with the interferometric observations (Pety & Rodríguez-Fernández 2010). The dirty image was deconvolved using the Högbom CLEAN algorithm. The resulting cubes were scaled from Jy/beam to brightness temperature scale using the synthesized beam size of 4.9′′ × 3.0′′. The achieved rms noise is ~10−20 mK per 0.5 km s-1 smoothed channel, with an absolute flux accuracy of ~10%. The resulting images are shown in Fig. 1.
In addition, we carried out pointed observations toward the DF with the IRAM 30 m telescope (Spain). The observed position lies roughly at the center of the ALMA-ACA field (see circles in Fig. 1). This position is at ΔRA =+3′′ and ΔDec =−3′′ from the “CO+ peak” of Stoerzer et al. (1995). These multi-line observations are part of a complete 80-360 GHz line survey at resolutions between ~30′′ and ~7′′ (Cuadrado et al. 2015).
3. Results: morphology and emission properties
In addition to the submillimeter (submm) emission images obtained with ALMA-ACA, panels b, c, and d in Fig. 1 show images of the DF traced by the vibrationally excited molecular hydrogen (H ) v = 1−0S(1) line (Walmsley et al. 2000), of the atomic PDR (hydrogen is predominantly in neutral atomic form) as traced by the Spitzer/IRAC 8 μm emission (Megeath et al. 2012), and of the ionization front (IF), the H/H+ transition zone. The δx axis shows the distance in arcsec to the IF. Thus, in each panel, the FUV-photon flux decreases from right to left.
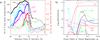 |
Fig. 2 a) ALMA-ACA averaged intensity cuts perpendicular to the Orion Bar. Except for CO J = 3−2 line (peak temperature in K), cuts show integrated line intensities (in K km s-1). Symbols do not have any meaning, they are used to improve figure readability. b) Isobaric model of a PDR with Pth/k = 2 × 10⁸ K cm-3 and χ = 104. In both figures, the FUV radiation from the Trapezium cluster comes from the right-hand side. |
The peak of the optically thick CO 3−2 line provides a good lower limit to the gas temperature in the molecular PDR (δx> 15′′), with 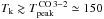 K (Fig. 1a). The ALMA-ACA images show that, except for SO+, the emission from reactive ions starts very close to the DF, and globally follows that of H. On small scales (≲3′′≈ 1000 AU), several emission peaks of these ions coincide with the brightest Hv = 1−0S(1) peaks (e.g., at δy ≃ −18′′). Although the SH+ and HOC+ peaks at δy ≃ + 27′′ do not exactly match a H2v = 1−0 peak, observations do show the presence of extended H2v = 2−1 and 1−0 emission along the SH+ and HOC+-emitting zone (van der Werf et al. 1996). In fact, H emission from very high vibrational levels (up to v = 10 or E/k ≈ 50 000 K) has recently been reported (Kaplan et al. 2017).
To investigate the molecular emission stratification, in Fig. 2a we show averaged emission cuts perpendicular to the Bar. The cuts demonstrate that the SH+ 10-01 and HOC+ 4−3 lines arise from a narrow emission layer (akin to a filament), with a half-power-width of Δ(δx) ≃ 10′′ (≃0.02 pc), that delineates the DF. The H13CO+ 4−3 line displays this emission peak close to the DF, as well as another peak deeper inside the molecular cloud (at δx ≈ 30′′) that is dominated by emission from the colder molecular cloud interior. The SO 89−78 line arises from these more FUV-shielded zones. These spatial emission trends are supported by the different line-widths (averaged over the ACA field of view, see Table A.1). In particular, the SO 89−78 line is narrower (Δv = 1.8 ± 0.1 km s-1) than the SO+ 15/2−–13/2+ (Δv = 2.1 ± 0.1 km s-1), HOC+ 4−3 (Δv = 2.7 ± 0.1 km s-1), and SH+ 10−01 (Δv = 2.8 ± 0.1 km s-1) lines that arise from the more FUV-irradiated gas near the molecular cloud edge.
We first derived H13CO+, HOC+, SO+, and SO rotational temperatures (Trot) and column densities (N) by building rotational population diagrams from our IRAM 30 m observations (line survey position, Cuadrado et al. 2015). Results are shown in Tables 1 and B.1. H13CO+ and HOC+ have high dipole moments (and SO+ to a lesser extent, but see Appendix D). Hence, the observed submm lines have moderate critical densities (several 106 H2 cm-3). The low-J transitions toward the line survey position are subthermal (Trot ≈ 15 K ≪ Tk). Their column densities are relatively small: from ~1011 cm-2 (assuming uniform beam filling), to ~1012 cm-2 (for a more realistic filamentary emission layer of ~10′′ width and correcting for beam dilution).
In addition, we estimated the average physical conditions that lead to the H13CO+, HOC+, SO+ and SH+ emission toward the line survey position. We used a Monte Carlo model (Appendix D) that includes inelastic collisions with H2 and e−, as well as radiative excitation by the far-IR dust radiation field in the region (see Arab et al. 2012, and Fig. D.1). This allowed us to refine the source-averaged column density estimation for a 10′′–wide emission layer (Table 1). The observed H13CO+, HOC+, and SO+ line intensities and Trot are reproduced with n(H2) ≃ 105 cm-3, n(e−) = 10 cm-3, and Tk ≳ 200 K (thus consistent with  ). However, with the set of assumed SH+ collisional rates, fitting the SH+ lines requires denser gas, ~106 cm-3 (see also Nagy et al. 2013). As Tk is expected to sharply vary along the DF (e.g., Sternberg & Dalgarno 1995), the result of these single-component models should be taken as average conditions (over the ACA resolution). We note that at the distance to Orion, 4′′ is equivalent to 1 mag of visual extinction for nH = 105 cm-3.
Low [HCO+]/[HOC+] abundance ratios (~200−400) have previously been inferred from lower angular resolution (10′′ to 70′′, depending on the line and telescope) pointed observations toward the Bar (Apponi et al. 1999; Fuente et al. 2003). Such ratios are much lower than those predicted in FUV-shielded gas (>1000, e.g., Goicoechea et al. 2009). Given the similar Aul coefficient and upper level energy (Eu/k) of the H13CO+ and HOC+ 4−3 transitions, their integrated intensity ratio is a good measure of the [HCO+]/[HOC+] isomeric ratio (lines are optically thin). The observed H13CO+/HOC+ 4−3 line ratio is equivalent to a roughly constant [HCO+]/[HOC+] ratio of 145 ± 5 along the δx = 12−22′′ layer (assuming [HCO+]/[H13CO+] = 67). The ratio then increases as the FUV-photon flux decreases, [HCO+]/[HOC+] = 180 ± 4 along the δx = 22−32′′ layer, until the HOC+ 4−3 signal vanishes deeper inside the molecular cloud.
4. Discussion
ALMA HCO+ 4−3 images at ~1′′ resolution suggest the presence of high-pressure structures, Pth/k = nH Tk ≈ (1−2) × 108 K cm-3, close to the DF (Goicoechea et al. 2016). Despite the different resolutions, several of these HCO+ peaks coincide with the brightest SH+ 10−01 and OH 84 μm peaks (Figs. 1e and f). Thus, it is reasonable to assume that SH+ arises from these structures.
We used version 1.5.2 of the Meudon PDR code (Le Petit et al. 2006) to model the formation and destruction of reactive ions in a constant thermal-pressure slab of FUV-irradiated gas (Pth/k from 2 × 10⁷ to 2 × 10⁸ K cm-3). Figure 2b shows abundance profiles (with respect to H nuclei) predicted by the high-pressure model. The FUV-photon flux is χ = 104 (in Draine units), the expected radiation field close to the DF. Compared to Nagy et al. (2013), we have included more recent rates for reactions of S+ with H2(v) (Zanchet et al. 2013). We adopt an undepleted sulfur abundance of [S] = 1.4 × 10⁻⁵ (Asplund et al. 2005). The predicted abundance stratification in Fig. 2b qualitatively agrees with the observational intensity cut in Fig. 2a (but recall that the spatial scales are not directly comparable, as for the studied range of Pth/k in these 1D isobaric models, 10 mag of visual extinction corresponds to 1−10′′). To be more specific, we compared the inferred column densities with those predicted by the PDR model (Table 1). Because the Orion Bar is not a perfect edge-on PDR, this comparison requires a knowledge of the tilt angle (α) with respect to a pure edge-on geometry, and of the line-of-sight cloud-depth (ldepth). Recent studies constrain α and ldepth to ≲4° and ≃0.28 pc, respectively (Salgado et al. 2016; Andree-Labsch et al. 2017). For this geometry, the intrinsic width of the SH+- and HOC+-emitting layer would be narrower, from ≃10′′ (the observed value) to ≃2′′ (if the Bar is actually tilted). Given these uncertainties, the agreement between the range of observed and predicted columns is satisfactory for HOC+, H13CO+, and SO+ (Table 1). Although PDR models with lower pressures predict qualitatively similar stratification, and a reactive ion abundance peak also at AV ≲ 1 mag (where C+, S+, and H coexist), a model with ten times lower Pth underestimates N(HOC+) and N(SO+) by large factors (≳20). This is related to the lower predicted OH column densities (by a factor of ~25), key in the formation of CO+, HOC+ and SO+ (Goicoechea et al. 2011). Interestingly, SO+ peaks deeper inside the cloud, while in the PDR models the main SO+ peak is close to that of SH+. Compared to the other ions, SO+ destruction near the DF is dominated by recombination and photodissociation (not by reactions with H2 or H). Hence, [SO+] depends on the [OH]/xe ratio (Turner 1996) and on the photodissociation rate. The SO+ line peaks deeper inside the cloud than the OH 2Π3/2J = 7/2−−5/2+ line (Fig. 1f) suggesting that near the DF either n(e−) is higher than in the model or, more likely, that the SO+ photodissociation rate is larger. Indeed, SO+ can be dissociated by lower E photons (<5 eV, Bissantz et al. 1992). This process is not taken into account in the PDR model.
Inferred column densities and PDR model predictions.
For SH+, we infer a column density that is a factor ≃3−30 above the PDR model prediction (depending on α). Recall that reaction S+ + H2(v) → SH+ + H (endothermic by ΔE/k ≃ 9860 K when v = 0) only becomes exothermic when v ≥ 2, but remains slow even then (Zanchet et al. 2013). The mismatch between model and observation, if relevant, may suggest an additional source of SH+ that is not well captured by the model: overabundant H2(v ≥ 2) or temperature/pressure spikes due to the PDR dynamics (Goicoechea et al. 2016).
Regardless of the excitation details, our observations show that detecting SH+ and HOC+ emission is an unambiguous indication of FUV-irradiated gas. Intriguingly, SH+ and HOC+ line-widths are narrower than those of CH+ (Δv ≃ 4.5−5.5 km s-1, Nagy et al. 2013; Parikka et al. 2017). The broader CH+ lines in the Bar have been interpreted as a signature of CH+ high reactivity (Nagy et al. 2013). In this view, the exothermicity (equivalent to an effective formation temperature of about 5360 K) of the dominant formation route, reaction C+ + H2(v ≥ 1) → CH+ + H, goes into CH+ excitation and motion. However, reactive collisions of CH+ with H and H2 are faster than elastic and rotationally inelastic collisions (see Appendices C and D). In particular, the CH+ lifetime is so short (a few hours) that the molecule does not have time to thermalize, by elastic collisions, its translational motions to a velocity distribution at Tk (Black 1998). Hence, the broad lines would be related to the energy excess upon CH+ formation (thousands of K) and not to the actual Tk (at Tk = 1000 K, the CH+ thermal line-width will only be 1.8 km s-1, Nagy et al. 2013), nor to an enhanced gas turbulence. Detailed models of the CH+ excitation show that inclusion of formation and destruction rates in the level population determination affects the high-J levels (Godard & Cernicharo 2013). Indeed, using the CH+J = 3−2 to 6−5 intensities measured by Herschel/PACS toward the line survey position (Nagy et al. 2013), we derive  K. This is significantly warmer than Trot of SH+, HOC+ and SO+.
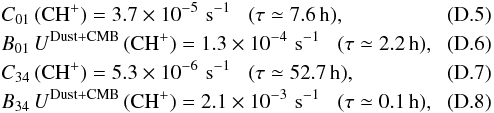
CH+ is a light hydride (see Gerin et al. 2016, for a review) meaning that its lowest rotational transitions lie at far-IR frequencies. Therefore, its critical densities are very high (ncr(CH+ 4−3) ≃7 × 10⁹ H2 cm-3, cf. ncr(HOC+ 4−3) ≃4 × 10⁶ H2 cm-3 at Tk = 200 K). Such values are much higher than the gas density in the Orion Bar. Thus, without an excitation mechanism other than collisions, one would expect Trot(CH+) ≪ Trot(HOC+). However, CH+ has a shorter lifetime than the other ions, and shorter than the timescale for inelastic collisional excitations. Hence, the higher  (CH+) compared to the heavier ions must be related to a formation, and perhaps radiative, pumping mechanism. In particular, the dust continuum emission is much stronger in the far-IR than in the (sub)mm (Fig. D.1). As a consequence, the far-IR CH+ rotational transitions have larger radiative pumping rates than the (sub)mm transitions of the heavier ions. As an example, we derive
  (CH+)/ (HOC+) ≈ 100 (where Blu is the stimulated absorption coefficient and U is the energy density produced by the dust emission and by the cosmic background; see Appendix D.1). Therefore, CH+ can be excited by radiation many times during its short lifetime (and during its mean-free-time for elastic collisions) so that it can remain kinetically hot (large velocity dispersion) and rotationally warm while it emits. On the other hand, the heavier ions are driven relatively more quicky toward smaller velocity dispersion by elastic collisions (narrower lines) and toward lower Trot by inelastic collisions. For HOC+, we estimate that several collisional excitations take place during its lifetime (several hours). This subtle but important difference likely explains the narrower lines and lower Trot of the heavier reactive ions, as well as their slightly different spatial distribution compared to CH+ (see Fig. 1e).
– For H13CO+ and HOC+ ( ground electronic states) we used HCO+-H2 de-excitation rates of Flower (1999), and specific HCO+-e− and HOC+-e− de-excitation rates (presented in Fuente et al. 2008, and references therein). We computed the respective collisional excitation rates through detailed balance. – For SH+ (
 ) there are no published collisional rate coefficients. For SH+-H2 we simply scaled radiative rates (J. Black, priv. comm.) for a 10−5000 K temperature range. For SH+-e− collisions we used rate coefficients calculated in the Coulomb-Born approximation for the 10−1000 K temperature range (J. Black, priv. comm.). – For SO+ (2Π) there are no published collisional rates. Here we modeled rotational levels in the
  ladder only (the
  ladder lies 525 K above the ground, much higher than the Trot(SO+) inferred from our observations) and neglected Λ-doubling transitions. For SO+-H2, we used CS-He rates of Lique et al. (2006) (CS has a similar molecular weight and dipole moment: 44 and 2.0 D, compared to SO+: 48 and 2.3 D. This is the adopted SO+ dipole moment after Turner 1996). Rate coefficients were multiplied by 2 to account for the ionic character of SO+. For SO+-e−, we used rate coefficients calculated in the Coulomb-Born approximation for the 10−1000 K range (J. Black, priv. comm.).
Acknowledgments
We thank A. Parikka for sharing her Herschel far-IR CH+ and OH line maps. We thank the ERC for funding support under grant ERC-2013-Syg-610256-NANOCOSMOS, and the Spanish MINECO under grants AYA2012-32032, AYA2016-75066-C2-(1/2)-P and CSD2009-00038.
References
- Agúndez, M., Goicoechea, J. R., Cernicharo, J., Faure, A., & Roueff, E. 2010, ApJ, 713, 662 [NASA ADS] [CrossRef] [Google Scholar]
- Andree-Labsch, S., Ossenkopf-Okada, V., & Röllig, M. 2017, A&A, 598, A2 [NASA ADS] [CrossRef] [EDP Sciences] [Google Scholar]
- Apponi, A. J., Pesch, T. C., & Ziurys, L. M. 1999, ApJ, 519, L89 [NASA ADS] [CrossRef] [Google Scholar]
- Arab, H., Abergel, A., Habart, E., et al. 2012, A&A, 541, A19 [NASA ADS] [CrossRef] [EDP Sciences] [Google Scholar]
- Asplund, M., Grevesse, N., & Sauval, A. J. 2005, in Cosmic Abundances as Records of Stellar Evolution and Nucleosynthesis, eds. T. G. Barnes, III, & F. N. Bash, ASP Conf. Ser., 336, 25 [Google Scholar]
- Benz, A. O., Bruderer, S., van Dishoeck, E. F., et al. 2016, A&A, 590, A105 [NASA ADS] [CrossRef] [EDP Sciences] [Google Scholar]
- Bissantz, H., Andric, L., Hertzler, C., Foth, H.-J., & Linder, F. 1992, Z. Phys. D Atoms Molecules Clusters, 22, 727 [Google Scholar]
- Black, J. H. 1998, Faraday Discussions, 109, 257 [Google Scholar]
- Cernicharo, J., Liu, X.-W., González-Alfonso, E., et al. 1997, ApJ, 483, L65 [NASA ADS] [CrossRef] [Google Scholar]
- Cuadrado, S., Goicoechea, J. R., Pilleri, P., et al. 2015, A&A, 575, A82 [NASA ADS] [CrossRef] [EDP Sciences] [Google Scholar]
- Flower, D. R. 1999, MNRAS, 305, 651 [NASA ADS] [CrossRef] [Google Scholar]
- Fuente, A., Rodríguez-Franco, A., García-Burillo, S., Martín-Pintado, J., & Black, J. H. 2003, A&A, 406, 899 [NASA ADS] [CrossRef] [EDP Sciences] [Google Scholar]
- Fuente, A., García-Burillo, S., Usero, A., et al. 2008, A&A, 492, 675 [NASA ADS] [CrossRef] [EDP Sciences] [Google Scholar]
- Gerin, M., Neufeld, D. A., & Goicoechea, J. R. 2016, ARA&A, 54, 181 [NASA ADS] [CrossRef] [Google Scholar]
- Godard, B., & Cernicharo, J. 2013, A&A, 550, A8 [NASA ADS] [CrossRef] [EDP Sciences] [Google Scholar]
- Goicoechea, J. R., Pety, J., Gerin, M., et al. 2006, A&A, 456, 565 [NASA ADS] [CrossRef] [EDP Sciences] [Google Scholar]
- Goicoechea, J. R., Pety, J., Gerin, M., et al. 2009, A&A, 498, 771 [NASA ADS] [CrossRef] [EDP Sciences] [Google Scholar]
- Goicoechea, J. R., Joblin, C., Contursi, A., et al. 2011, A&A, 530, L16 [NASA ADS] [CrossRef] [EDP Sciences] [Google Scholar]
- Goicoechea, J. R., Pety, J., Cuadrado, S., et al. 2016, Nature, 537, 207 [NASA ADS] [CrossRef] [Google Scholar]
- Hierl, P. M., Morris, R. A., & Viggiano, A. A. 1997, J. Chem. Phys., 106, 10145 [NASA ADS] [CrossRef] [Google Scholar]
- Hollenbach, D. J., & Tielens, A. G. G. M. 1999, Rev. Mod. Phys., 71, 173 [Google Scholar]
- Kaplan, K. F., Dinerstein, H. L., Oh, H., et al. 2017, ApJ, 838, 2 [NASA ADS] [CrossRef] [Google Scholar]
- Le Petit, F., Nehmé, C., Le Bourlot, J., & Roueff, E. 2006, ApJS, 164, 506 [NASA ADS] [CrossRef] [EDP Sciences] [Google Scholar]
- Lique, F., Spielfiedel, A., & Cernicharo, J. 2006, A&A, 451, 1125 [NASA ADS] [CrossRef] [EDP Sciences] [Google Scholar]
- Megeath, S. T., Gutermuth, R., Muzerolle, J., et al. 2012, AJ, 144, 192 [NASA ADS] [CrossRef] [Google Scholar]
- Menten, K. M., Reid, M. J., Forbrich, J., & Brunthaler, A. 2007, A&A, 474, 515 [NASA ADS] [CrossRef] [EDP Sciences] [Google Scholar]
- Müller, H. S. P., Goicoechea, J. R., Cernicharo, J., et al. 2014, A&A, 569, L5 [NASA ADS] [CrossRef] [EDP Sciences] [Google Scholar]
- Nagy, Z., Choi, Y., Ossenkopf-Okada, V., et al. 2017, A&A, 599, A22 [NASA ADS] [CrossRef] [EDP Sciences] [Google Scholar]
- Nagy, Z., Van der Tak, F. F. S., Ossenkopf, V., et al. 2013, A&A, 550, A96 [NASA ADS] [CrossRef] [EDP Sciences] [Google Scholar]
- Parikka, A., Habart, E., Bernard-Salas, J., et al. 2017, A&A, 599, A20 [NASA ADS] [CrossRef] [EDP Sciences] [Google Scholar]
- Pellegrini, E. W., Baldwin, J. A., Ferland, G. J., Shaw, G., & Heathcote, S. 2009, ApJ, 693, 285 [NASA ADS] [CrossRef] [Google Scholar]
- Pety, J., & Rodríguez-Fernández, N. 2010, A&A, 517, A12 [NASA ADS] [CrossRef] [EDP Sciences] [Google Scholar]
- Salgado, F., Berné, O., Adams, J. D., et al. 2016, ApJ, 830, 118 [NASA ADS] [CrossRef] [Google Scholar]
- Smith, M. A., Schlemmer, S., von Richthofen, J., & Gerlich, D. 2002, ApJ, 578, L87 [NASA ADS] [CrossRef] [Google Scholar]
- Sternberg, A., & Dalgarno, A. 1995, ApJS, 99, 565 [NASA ADS] [CrossRef] [Google Scholar]
- Stoerzer, H., Stutzki, J., & Sternberg, A. 1995, A&A, 296, L9 [NASA ADS] [Google Scholar]
- Turner, B. E. 1996, ApJ, 468, 694 [NASA ADS] [CrossRef] [Google Scholar]
- van der Werf, P. P., Stutzki, J., Sternberg, A., & Krabbe, A. 1996, A&A, 313, 633 [NASA ADS] [Google Scholar]
- Walmsley, C. M., Natta, A., Oliva, E., & Testi, L. 2000, A&A, 364, 301 [NASA ADS] [Google Scholar]
- Zanchet, A., Agúndez, M., Herrero, V. J., Aguado, A., & Roncero, O. 2013, AJ, 146, 125 [NASA ADS] [CrossRef] [Google Scholar]
Appendix A: Spectroscopic parameters of the observed lines
Frequencies, energy levels, Einstein coefficients and line parameters of the ALMA-ACA spectra averaged over the observed field.
Appendix B: Rotational population diagrams and column densities
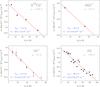 |
Fig. B.1 Rotational diagrams obtained from IRAM 30 m observations toward the line survey position (Cuadrado et al. 2015) assuming optically thin emission and uniform beam filling. Fitted values of Trot, column density, and their respective uncertainties are indicated. |
Rotational temperatures (Trot) and column densities (N) inferred from IRAM 30 m observations toward the line survey position.
Appendix C: Chemical destruction timescales
In this Appendix we use the rates of the chemical reactions (included in our PDR model) that lead to the destruction of reactive ions, to compute their characteristic destruction timescales in the Orion Bar. For simplicity we adopt Tk = Te = 300 K.
The destruction timescales of CH+ by reactive collisions with H2 and H are τCH+(H2) ≃ 4.6 h (105 cm-3/nH)  and τCH+(H) ≃ 3.7 h (105 cm-3/nH) (1−fH2)-1, respectively. In these relations, fH2 = 2n(H2)/[n(H)+2n(H2)] is the molecular gas fraction (<1 close to the DF of PDRs). The CH+ destruction timescale by dissociative recombination is slower, τCH+(e−) ≃185 h (105 cm-3/nH) (10-4/xe).
On the other hand, SH+ slowly reacts with H2 (the reaction is very endothermic). The relevant destruction timescales are τSH+(H) ≃25 h (105 cm-3/nH) (1−fH2)-1 and τSH+(e−) ≃ 111 h (105 cm-3/nH) (10-4/xe).
For HOC+ we derive τHOC+(H2) ≃ 14.6 h (105 cm-3/nH) and τHOC+(e−) ≃ 252 h (105 cm-3/nH) (10-4/xe).
SO+ lifetime is longer. The reaction of SO+ with H is very endothermic. Close to the DF, SO+ destruction is dominated by dissociative recombination, with τSO+(e−) ≃ 139 h (105 cm-3/nH) (10-4/xe), and by photodissociation, with τSO+(ph) = 27.8 h e+ 1.7 AV for χ = 104. In our PDR models we assume κSO+(ph) = χ × 10-9 e− 1.7 AV (s-1), which is ≃1000, ≃10, ≃5, and ≃4 times faster than the adopted κHCO+(ph), κCH+(ph), κOH(ph), and κSH+(ph) photodissociation rates, respectively (at AV = 1). A summary of the relevant destruction timescales is presented in Table D.1.
Appendix D: Collisional and radiative excitation of H13CO+, HOC+, SH+, and SO+
To estimate the physical conditions of the reactive ions emitting gas, we solved the statistical equilibrium equations and radiative transfer using a non-local-thermodynamic equilibrium code (Goicoechea et al. 2006). In PDRs, the high electron density (up to n(e−) ≃ x(C+) nH ≃ 10-4nH for standard cosmic ray ionization rates) plays an important role in the collisional excitation of molecular ions and competes with collisions with H2 and H. This is because the associated collisional excitation rate coefficients γlu(e) (cm3 s-1) can be large, up to 104 times γlu(H2), and thus H2 and e collisional rates (s-1) become comparable if the ionization fraction n(e−) /nH is high, xe ≃ 10-5−10-4. Here we used published (or estimated by us) inelastic collisional rate coefficients1, and we adopted n(e−) = 10 cm-3 and nH ≃ 104−106 cm-3 in the models, the expected range of densities in the region.
In addition to inelastic collisions, we included radiative excitation by absorption of the 2.7 K cosmic background and by the (external) dust radiation field in the region. The latter is modelled as a modified blackbody emission with an effective dust temperature of Td = 50 K, spectral emissivity index of β = 1.6, and a dust opacity (τd) of ≃0.03 at a reference wavelength of λ = 160 μm. The resulting continuum levels (Fig. D.1) reproduce the far-IR photometric measurements toward the Orion Bar; we refer to Arab et al. (2012). These authors estimated Td ≃ 50 K inside the Bar and Td ≃ 70 K immediately in front. Our calculations include thermal, turbulent, and line opacity broadening. The non-thermal velocity dispersion that reproduces the observed line-widths is σ ≃ 1 km s-1 (with full width at half maximum of 2.355·σ).
By varying N, nH and Tk, we tried to reproduce the H13CO+, HOC+, SH+, and SO+ line intensities observed by ALMA-ACA toward the line survey position as well as the intensities of the other rotational lines detected with the IRAM-30 m telescope (correcting them by a dilution factor that takes into account the beam size at each frequency and an intrinsic 10′′-wide Gaussian filament shape of the emission). Our best models fit the intensities by less than a factor of 2. They also reproduce (±3 K) the Trot inferred from the rotational population diagrams for a 10′′-wide filament (see Table B.1). For H13CO+, HOC+, and SO+, we obtain n(H2) ≃ 105 cm-3, n(e−) = 10 cm-3, and Tk ≳ 200 K. These conditions agree with those inferred by Nagy et al. (2017) for the H12CO+ rotationally excited emission (J = 6−5 to 11−10) observed by Herschel/HIFI.
For SH+, we reproduce the line intensities observed by ALMA-ACA at ~345 GHz, and by Herschel/HIFI at ~526 GHz Nagy et al. (2013; significantly diluted in the large HIFI beam according to our ALMA-ACA images), if the gas is an order of magnitude denser, ~106 cm-3 (similar to Nagy et al. 2013 as they used the same estimated collisional rates).
Appendix D.1: Radiative pumping rates (CH+ vs. HOC+)
To support our interpretation, here we compare the collisional and radiative pumping rates of CH+ and HOC+ rotational lines with their chemical destruction timescales. The inelastic collisional excitation rate (Clu) is given by ![Mathematical equation: \appendix \setcounter{section}{4} \begin{equation} C_{\rm lu} = n({\rm H_2}) \, \gamma_{\rm lu}({\rm H_2}) + n({\rm e}^-) \, \gamma_{\rm lu}({\rm {{\rm e}^-}}) \,\,\,\,\,\,\, [{\rm s^{-1}}], \end{equation}](/articles/aa/full_html/2017/05/aa30716-17/aa30716-17-eq186.png) (D.1)where we assume that H2 and e− are the only collisional partners. The upward excitation collisional coefficients γlu (cm3 s-1) are computed from the de-excitation coefficients by detailed balance
(D.1)where we assume that H2 and e− are the only collisional partners. The upward excitation collisional coefficients γlu (cm3 s-1) are computed from the de-excitation coefficients by detailed balance ![Mathematical equation: \appendix \setcounter{section}{4} \begin{equation} \gamma_{\rm lu} = \gamma_{\rm ul}\,\frac{g_u}{g_l}\,{\rm e}^{-T^*/T_{\rm k}} \,\,\,\,\,\,\, [{\rm cm^3\,s^{-1}}], \end{equation}](/articles/aa/full_html/2017/05/aa30716-17/aa30716-17-eq189.png) (D.2)where T∗ = hν/k is the equivalent temperature at the frequency ν of the transition. The continuum energy density in the cloud at a given frequency is
(D.2)where T∗ = hν/k is the equivalent temperature at the frequency ν of the transition. The continuum energy density in the cloud at a given frequency is ![Mathematical equation: \appendix \setcounter{section}{4} \begin{equation} U^{\rm Dust+CMB} = \beta \, [U(T_{\rm d}) + U(T_{\rm cmb})], \end{equation}](/articles/aa/full_html/2017/05/aa30716-17/aa30716-17-eq192.png) (D.3)where U(Td) is the contribution from the external dust radiation field, and U(Tcmb = 2.73 K) is the cosmic background. β is the photon escape probability that tends to 1 if the line opacity tends to 0. The radiative pumping rate can be written as
(D.3)where U(Td) is the contribution from the external dust radiation field, and U(Tcmb = 2.73 K) is the cosmic background. β is the photon escape probability that tends to 1 if the line opacity tends to 0. The radiative pumping rate can be written as ![Mathematical equation: \appendix \setcounter{section}{4} \begin{equation} \label{rate-BU} B_{\rm lu}\, U^{\rm Dust+CMB} = \beta \, A_{\rm ul} \, \left[\frac{1-{\rm e}^{-\tau_{\rm d}}}{{\rm e}^{T^*/T_{\rm d}}-1} + \frac{1}{{\rm e}^{T^*/T_{\rm cmb}}-1} \right] \,\,\,\,\,\,\, [{\rm s^{-1}}], \end{equation}](/articles/aa/full_html/2017/05/aa30716-17/aa30716-17-eq196.png) (D.4)where Blu and Aul are the Einstein coefficients for stimulated absorption and for spontaneous emission, respectively. As an example of the excitation differences between CH+ and the heavier reactive ions, we note that the CH+ 4−3 line lies at a far-IR wavelength (λ ≃ 90 μm) where the intensity of the continuum emission toward the Orion Bar is ≳200 times stronger than that at the submm HOC+ 4−3 line wavelength (λ ≃ 837 μm; see Fig. D.1).
(D.4)where Blu and Aul are the Einstein coefficients for stimulated absorption and for spontaneous emission, respectively. As an example of the excitation differences between CH+ and the heavier reactive ions, we note that the CH+ 4−3 line lies at a far-IR wavelength (λ ≃ 90 μm) where the intensity of the continuum emission toward the Orion Bar is ≳200 times stronger than that at the submm HOC+ 4−3 line wavelength (λ ≃ 837 μm; see Fig. D.1).
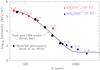 |
Fig. D.1 Dust continuum emission (with Td = 50 K) and cosmic millimeter background model used in the excitation calculation. Black circles show Herschel’s photometric observations toward the Orion Bar. Red triangles show the wavelength position of CH+ rotational lines. Their intensity scale is that of a black body at 150 K (≈ |

We adopt n(H2) = 105 cm-3, n(e−) = 10 cm-3, Tk = Te = 200 K, and our model of the continuum emission (Fig. D.1). With these parameters, using the appropriate collisional rate coefficients (see Nagy et al. 2013; Godard & Cernicharo 2013, for detailed CH+ excitation models), and in the β = 1 limit, we compute the following collisional and radiative pumping rates
 for CH+, and
 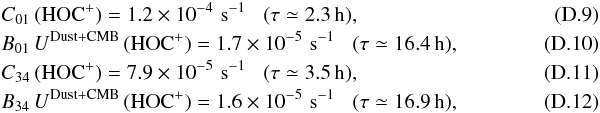 for HOC+. The quantities in parenthesis (τ) represent the corresponding timescale for each excitation process (see Table D.2). In the case of reactive molecular ions, these rates compete with their chemical destruction timescales (derived in Appendix C). Adopting a gas density of 105 cm-3, fH2=0.5 and xe = 10-4 for the Orion Bar, the total CH+ and HOC+ chemical destruction timescales are τD(CH+) ≃ 4 h and τD(HOC+) ≃ 26 h (see Table D.1). Comparing τD(CH+) with the timescales for collisional and radiative excitation shows that CH+ molecules are excited by radiation many times during its short lifetime, but not by collisions. Hence, CH+ can remain rotationally warm while it emits. Interestingly, the far-IR CH+ lines observed by PACS (J = 3−2 to 6−5, Nagy et al. 2013) follow roughly the same functional shape, ∝Bλ (
 K), of the warm dust continuum emission (with Td ≃ 50−70 K; Fig. D.1). Because for CH+ radiative processes are faster than collisional processes (Table D.2), CH+ molecules might have equilibrated with the dust radiation field they absorb (Black 1998). However, Godard & Cernicharo (2013) conclude that the high-J CH+ lines in the Bar are mostly driven by formation pumping; thus, naturally producing warm rotational temperatures. On the other hand, comparing τD(HOC+) with the representative timescales for collisional and radiative excitation shows that HOC+ molecules (and likely the other heavier ions as well) are excited by collisions several times during their lifetime. Inelastic collisions thus can drive their rotational populations to lower Trot relatively fast.
Timescales, in hours, for chemical destruction by reactive collisions with H2, H, e− and by FUV photodissociation.
Representative timescales for non-reactive inelastic collisions and for radiative excitations of CH+ and HOC+ low-lying levels.
All Tables
Frequencies, energy levels, Einstein coefficients and line parameters of the ALMA-ACA spectra averaged over the observed field.
Rotational temperatures (Trot) and column densities (N) inferred from IRAM 30 m observations toward the line survey position.
Timescales, in hours, for chemical destruction by reactive collisions with H2, H, e− and by FUV photodissociation.
Representative timescales for non-reactive inelastic collisions and for radiative excitations of CH+ and HOC+ low-lying levels.
All Figures
|
Fig. 1 ALMA-ACA and complementary images of the Bar. All images have been rotated to bring the FUV illuminating direction roughly in the horizontal direction (from the right). The circles indicate the position of our IRAM 30 m line survey, with beams of ≈8′′ (≈30′′) at 1 mm (3 mm). The upper row shows images of b) the H2v = 1−0S(1) line at 2.12 μm, delineating the DF (Walmsley et al. 2000); c) the Spitzer 8 μm emission produced mainly by PAHs (Megeath et al. 2012), and d) the fluorescent O i line at 1.32 μm at the H ii/PDR boundary (Walmsley et al. 2000). The blue contours in e) and f) represent the CH+ 119.8 μm (≈9′′ resolution) and OH 84.6 μm (≈6′′) lines mapped by Herschel (Parikka et al. 2017). |
| In the text | |
|
Fig. 2 a) ALMA-ACA averaged intensity cuts perpendicular to the Orion Bar. Except for CO J = 3−2 line (peak temperature in K), cuts show integrated line intensities (in K km s-1). Symbols do not have any meaning, they are used to improve figure readability. b) Isobaric model of a PDR with Pth/k = 2 × 10⁸ K cm-3 and χ = 104. In both figures, the FUV radiation from the Trapezium cluster comes from the right-hand side. |
| In the text | |
|
Fig. B.1 Rotational diagrams obtained from IRAM 30 m observations toward the line survey position (Cuadrado et al. 2015) assuming optically thin emission and uniform beam filling. Fitted values of Trot, column density, and their respective uncertainties are indicated. |
| In the text | |
|
Fig. D.1 Dust continuum emission (with Td = 50 K) and cosmic millimeter background model used in the excitation calculation. Black circles show Herschel’s photometric observations toward the Orion Bar. Red triangles show the wavelength position of CH+ rotational lines. Their intensity scale is that of a black body at 150 K (≈ |
| In the text | |
Current usage metrics show cumulative count of Article Views (full-text article views including HTML views, PDF and ePub downloads, according to the available data) and Abstracts Views on Vision4Press platform.
Data correspond to usage on the plateform after 2015. The current usage metrics is available 48-96 hours after online publication and is updated daily on week days.
Initial download of the metrics may take a while.