Fig. 1
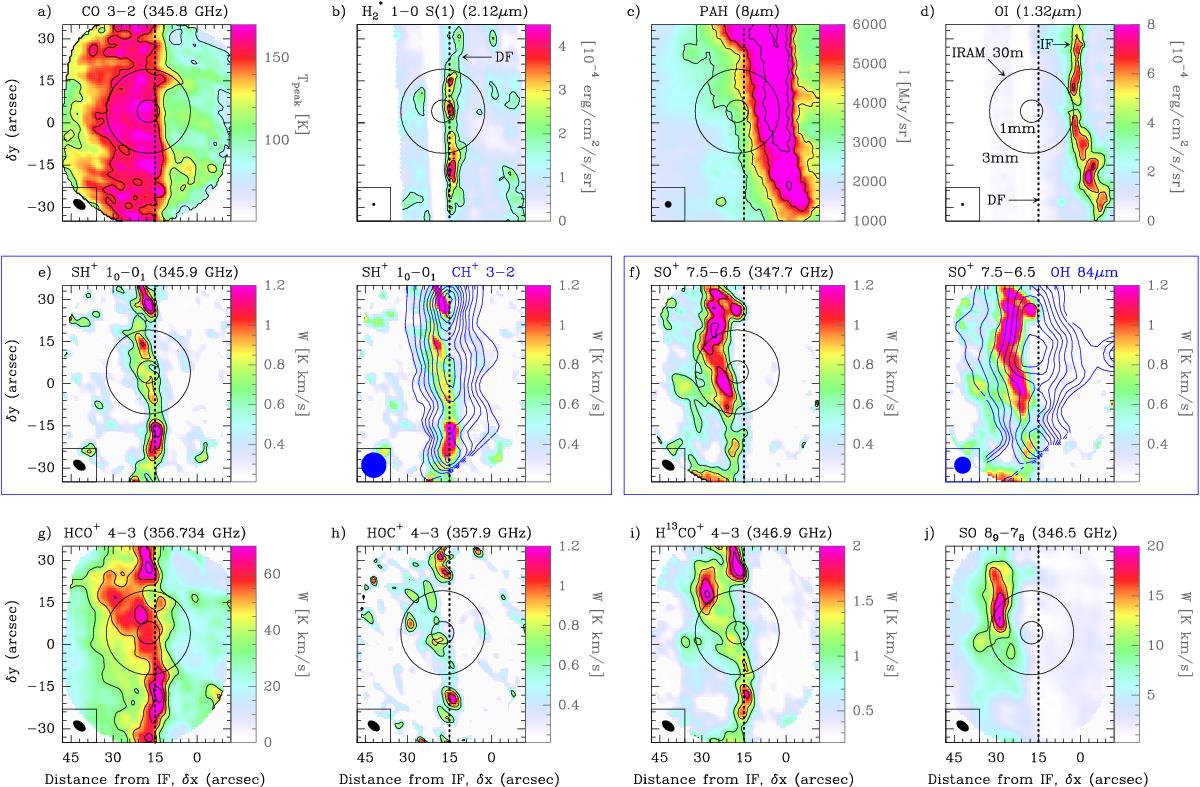
ALMA-ACA and complementary images of the Bar. All images have been rotated to bring the FUV illuminating direction roughly in the horizontal direction (from the right). The circles indicate the position of our IRAM 30 m line survey, with beams of ≈8′′ (≈30′′) at 1 mm (3 mm). The upper row shows images of b) the H2v = 1−0S(1) line at 2.12 μm, delineating the DF (Walmsley et al. 2000); c) the Spitzer 8 μm emission produced mainly by PAHs (Megeath et al. 2012), and d) the fluorescent O i line at 1.32 μm at the H ii/PDR boundary (Walmsley et al. 2000). The blue contours in e) and f) represent the CH+ 119.8 μm (≈9′′ resolution) and OH 84.6 μm (≈6′′) lines mapped by Herschel (Parikka et al. 2017).
Current usage metrics show cumulative count of Article Views (full-text article views including HTML views, PDF and ePub downloads, according to the available data) and Abstracts Views on Vision4Press platform.
Data correspond to usage on the plateform after 2015. The current usage metrics is available 48-96 hours after online publication and is updated daily on week days.
Initial download of the metrics may take a while.