Fig. 2
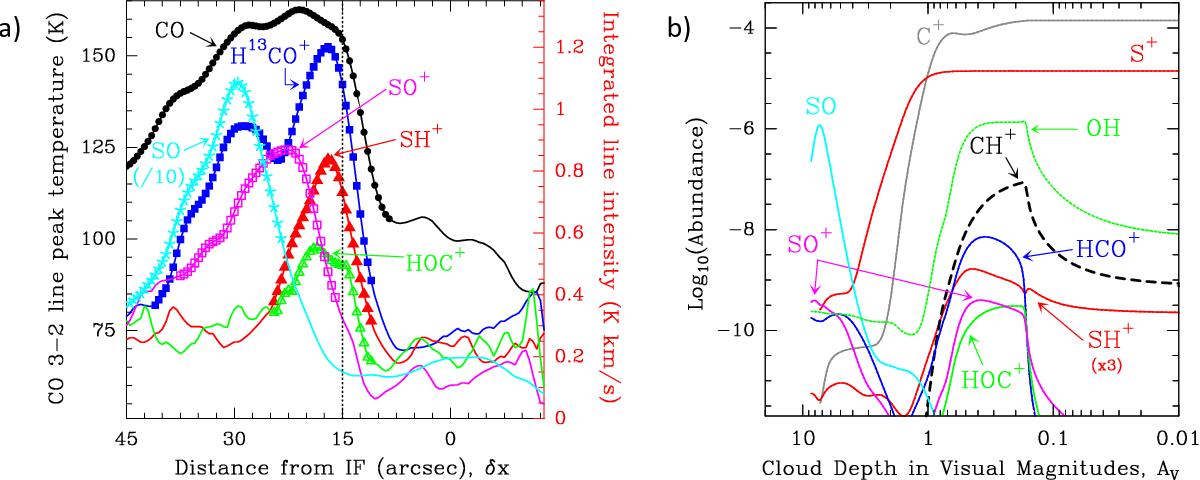
a) ALMA-ACA averaged intensity cuts perpendicular to the Orion Bar. Except for CO J = 3−2 line (peak temperature in K), cuts show integrated line intensities (in K km s-1). Symbols do not have any meaning, they are used to improve figure readability. b) Isobaric model of a PDR with Pth/k = 2 × 10⁸ K cm-3 and χ = 104. In both figures, the FUV radiation from the Trapezium cluster comes from the right-hand side.
Current usage metrics show cumulative count of Article Views (full-text article views including HTML views, PDF and ePub downloads, according to the available data) and Abstracts Views on Vision4Press platform.
Data correspond to usage on the plateform after 2015. The current usage metrics is available 48-96 hours after online publication and is updated daily on week days.
Initial download of the metrics may take a while.