| Issue |
A&A
Volume 599, March 2017
|
|
|---|---|---|
| Article Number | A39 | |
| Number of page(s) | 11 | |
| Section | Stellar structure and evolution | |
| DOI | https://doi.org/10.1051/0004-6361/201629969 | |
| Published online | 24 February 2017 | |
The puzzle of the CNO isotope ratios in asymptotic giant branch carbon stars
1 Dpto. Física Teórica y del Cosmos, Universidad de Granada, 18071 Granada, Spain
e-mail: This email address is being protected from spambots. You need JavaScript enabled to view it.
2 Observatorio Astronómico Calar Alto, 04550 Gergal (Almería), Spain
3 INAF, Osservatorio Astronomico di Collurania, 64100 Teramo, Italy
Received: 27 October 2016
Accepted: 11 November 2016
Abstract
Context. The abundance ratios of the main isotopes of carbon, nitrogen and oxygen are modified by the CNO-cycle in the stellar interiors. When the different dredge-up events mix the burning material with the envelope, valuable information on the nucleosynthesis and mixing processes can be extracted by measuring these isotope ratios.
Aims. Previous determinations of the oxygen isotopic ratios in asymptotic giant branch (AGB) carbon stars were at odds with the existing theoretical predictions. We aim to redetermine the oxygen ratios in these stars using new spectral analysis tools and further develop discussions on the carbon and nitrogen isotopic ratios in order to elucidate this problem.
Methods. Oxygen isotopic ratios were derived from spectra in the K-band in a sample of galactic AGB carbon stars of different spectral types and near solar metallicity. Synthetic spectra calculated in local thermodynamic equillibrium (LTE) with spherical carbon-rich atmosphere models and updated molecular line lists were used. The CNO isotope ratios derived in a homogeneous way, were compared with theoretical predictions for low-mass (1.5–3 M⊙) AGB stars computed with the FUNS code assuming extra mixing both during the RGB and AGB phases.
Results. For most of the stars the 16O/17O/18O ratios derived are in good agreement with theoretical predictions confirming that, for AGB stars, are established using the values reached after the first dredge-up (FDU) according to the initial stellar mass. This fact, as far as the oxygen isotopic ratios are concerned, leaves little space for the operation of any extra mixing mechanism during the AGB phase. Nevertheless, for a few stars with large 16O/17O/18O, the operation of such a mechanism might be required, although their observed 12C/13C and 14N/15N ratios would be difficult to reconcile within this scenario. Furthermore, J-type stars tend to have lower 16O/17O ratios than the normal carbon stars, as already indicated in previous studies. Excluding these peculiar stars, AGB carbon stars occupy the same region as pre-solar type I oxide grains in a 17O/16O vs. 18O/16O diagram, showing little spread. This reinforces the idea that these grains were probably formed in low-mass stars during the previous O-rich phases.
Key words: stars: AGB and post-AGB / stars: abundances / nuclear reactions, nucleosynthesis, abundances
© ESO, 2017
1. Introduction
Asymptotic giant branch (AGB) stars are one of the major chemical polluters of the interstellar medium (ISM) in the galaxies. It is believed that more than 50% of the material returned to the ISM by dying stars comes from AGB stars (e.g., Goswami 2014), which constitute the late phase in the evolution of low-and intermediate-mass (1 ≲ M/M⊙ ≲ 8) stars. AGB stars also play a key role in the formation of the ISM dust as many grain species form in their cool circumstellar envelope (e.g. Gehrz 1989). Many of these interstellar grains present in the protosolar nebula and preserved in meteorites, can now be analyzed in the laboratory (see e.g., Davis 2011) with unprecedented accuracy. The composition of the AGB ejecta depends on the initial composition and on the nuclear and mixing processes occurring during the stellar lifetime. Of special interest in this sense are the isotopic ratios of carbon (12,13C), nitrogen (14,15N), and oxygen (16,17,18O).
Stars in the red giant branch (RGB) undergo the so-called first dredge-up (FDU), a convective mixing process that carries nuclei from internal layers, previously affected by partial CNO cycling to the surface. It is well established that this leads to a decrease in the atmospheric 12C/13C ratio with respect to the main sequence (MS) value (~ 89 in the solar case), down to values in the range 20–30 (depending on the initial mass and metallicity of the star, see e.g. Weiss et al. 2000). In addition, the carbon abundance drops in the envelope, while that of 14N increases and 15N is depleted, so the 14N/15N ratio increases respect to the initial value (459 in the solar case, Marty et al. 2011). The 16O abundance remains unaltered, while that of 17O increases by ~ 50% and 18O is mildly reduced. The oxygen isotopic ratios predicted by the models after the FDU are modified with respect to the solar values ((16O /17O)⊙ = 2700 and (16O /18O)⊙ = 498, Lodders & Palme 2009); their values depend on the initial stellar mass and metallicity and have changed strongly in recent years as a consequence of changes in basic CNO cycle reaction rates. The present situation for the CNO ratios after the FDU as a function of the stellar mass, updated with the last version of the FUNS evolutionary code (Straniero et al. 2006) and with the last recommendations available for the relevant reaction rates (Adelberger et al. 2011; Boeltzig et al. 2016), is summarized in Table 1.
A second dredge-up (SDU) takes place in stars with M > 4 M⊙ during the early-AGB phase bringing to the surface fresh 4He and 14N mainly, although the CNO isotopic ratios in the envelope are not significantly modified. During the main AGB phase a third dredge-up (TDU) occurs when the convective envelope penetrates inward into the H-exhausted core after a thermal pulse (TP). Products of the He burning are mixed into the envelope as a consequence of the recurrent TDU episodes. 12C is the main product of the He burning so that the 12C/13C ratio is expected to increase significantly in the envelope during the TP-AGB phase from the values previously set by the FDU. Eventually, the amount of carbon in the envelope might exceed that of oxygen (C/O > 1, by number), and then the star becomes an AGB carbon star. Standard AGB models indicate that carbon stars are formed between masses 1.5–3 M⊙1. In models with initial mass M < 1.5 M⊙, the envelope mass at the beginning of the AGB phase is quite small, so that only a few thermal pulses will be experienced before the end of the AGB. As a consequence the amount of carbon eventually dredged-up is not enough to attain the carbon star condition. Models also show that the 14N/15N and 16O/17O/18O ratios are barely modified by TDUs (see Iben & Renzini 1983; Karakas & Lattanzio 2014; Cristallo et al. 2015, for a review), so the expected N and O isotopic ratios at the surface of an AGB star would be basically those after the FDU. Two occurrences prevent AGB stars with mass larger than 3–4 M⊙ to become carbon stars (see, e.g., Straniero et al. 2014). First, the larger the core mass the weaker the TDU. Second, the temperature at the base of the convective envelope may be high enough to convert C in to N. It is the well-known Hot Bottom Burning (see Iben & Renzini 1983). In this case, important modification of the C, N and O isotopic ratios are expected (see e.g. Ventura et al. 2015, and references therein) as well as of other light elements (Li, Na, Mg, Al).
Predicted CNO ratios (by number) after the FDU at solar metallicity (Z = 0.014, Y = 0.27).
Nevertheless, this standard picture is challenged by a large amount of abundance determinations (see for example Brown & Wallerstein 1989; Gratton et al. 2000; Charbonnel 2004; Grundahl et al. 2002) in field and globular cluster, low-mass (<3 M⊙) RGB stars. These stars show very low 12C/13C ratios, sometimes almost reaching the equilibrium value of the CN cycle (~ 3.5). Anomalies in the C and O isotopes are also found in pre-solar C-rich and O-rich grains of stellar origin (e.g., Amari et al. 2001; Nittler et al. 2008). It became common to attribute these chemical anomalies to the occurrence of episodes of matter circulation and/or diffusive processes (Wasserburg et al. 1995; Nollett et al. 2003; Palmerini et al. 2011; Denissenkov et al. 1998; Eggleton et al. 2006). These phenomena, known under the generic name of extra mixing, would link the envelope to regions where proton capture takes place, thus accounting for the observation that the envelope material has undergone extensive nuclear processing. The specific mechanism triggering this extra mixing is not known, although rotational (meridional) mixing, magnetic buoyancy, gravitational waves, and thermohaline circulation have been proposed (Nordhaus et al. 2008; Charbonnel & Lagarde 2010; Nucci & Busso 2014). The existence of this non-standard mixing is widely accepted (whatever is its nature) after the so-called bump in the luminosity function during the RGB phase, but its operation on the AGB phase is highly debated (Lebzelter et al. 2008; Karakas et al. 2010; Busso et al. 2010). In fact, the only observational evidence is the low 12C/13C (<30) ratios found (Olofsson et al. 1993; Abia et al. 2002; Milam et al. 2009) in a significant fraction (~ 30%) of Galactic AGB carbon stars. This poses a problem since standard AGB models predict a minimum of 12C/13C ~ 30 at C/O > 1, that is, at the C-rich AGB phase for solar metallicity. This prediction is very robust as it only depends on the assumption that 16O and 13C content in the envelope does not change due to operation of the TDU, which is actually the case (see figures in Abia 2011; Hinkle et al. 2016). Even assuming that these stars arrive to the AGB phase with a low carbon ratio ((12C/13C)RGB ~ 12) as commonly observed in bright RGB stars in the Galactic disk, the minimum value predicted on the AGB at C/O = 1 is 12C/13C ~ 30. Note that this is independent of the efficiency of the TDU and other model assumptions.
A valuable piece of information on this discussion is provided by the 14N/15N ratio. This is because the operation of the CNO cycle easily destroys 15N by proton capture reactions while it simultaneously produces 14N. Thus, theoretically, the occurrence of extra mixing episodes during the RGB or/and AGB, would increase the 14N/15N from the value typically attained after the FDU (~ 1000 assuming a solar initial ratio, see Table 1). Recently, Hedrosa et al. (2013) measured this isotopic ratio for the first time in a sample of Galactic AGB carbon stars. Despite the large uncertainties, the nitrogen ratios found for normal (N-type) carbon stars lay above 14N/15N ≳ 1000. As their detection limit was 14N/15N ≲ 5000, these authors cannot exclude the existence of carbon stars with higher nitrogen ratio but then an anti-correlation between nitrogen and carbon isotopic ratios would be expected, which is not observed (see Fig. 2 in Hedrosa et al. 2013). This figure is in agreement with standard theoretical models for low-mass TP-AGB stars (e.g., Cristallo et al. 2015) and, therefore, disfavors the operation of extra mixing during the AGB phase.
Additional information can be extracted from the 16O/17O/18O ratios in red giants. Oxygen ratio determinations in field low-mass RGB stars show a general agreement with standard theoretical predictions after the FDU (see e.g., Harris et al. 1988; Smith & Suntzeff 1989; Smith & Lambert 1990), although the expected dependence on the stellar mass (see Table 1) has not been fully confirmed, mainly because the large uncertainties in the observations and determination of the stellar masses. Attempts to do this in bright Galactic RGB stars with well-known stellar parameters or in giant stars belonging to globular clusters with accurate ages and distances (thus, turn-off mass) show, nevertheless, a comfortable agreement with stellar models; requiring, in some cases, the existence of extra mixing (Abia et al. 2012) while not in others (Lebzelter et al. 2015). On the other hand, previous determinations of the oxygen isotopic ratios in AGB stars date from the late 80’s (Dominy et al. 1986; Harris et al. 1987; Smith & Lambert 1990). In particular, Harris et al. (1987, hereafter H87) derived oxygen ratios in carbon stars of N-, SC- and J-types. For ordinary N-type stars they found  O/17O ≤ 4100 and
  O/18O ≤ 2400, and for J- and SC-type stars a tendency to show lower 16O/17O ratios than the N-type was found. Also, they discovered a correlation between the 16O/17O ratio and the neutron exposure2. These results were extremely difficult to explain in terms of the stellar evolution models at that time. Such large 16O/17O and 16O/18O ratios (>1500) are found however, in some pre-solar oxide grains (those of group I and II, see WUSTL Pre-Solar Database3), which are thought to form in oxygen-rich environments (Huss et al. 1992) such as RGB and AGB stars with M< 2 M⊙. In fact, Palmerini et al. (2013) showed that the oxide grains depleted in 18O (thus with large 16O/18O ratios) can be explained assuming some kind of extra mixing both during the RGB and AGB phases. Very recently, Hinkle et al. (2016) have derived oxygen ratios in O-rich AGB stars of Mira and SRa variability types. The 16O/17O ratios derived are within a large range 200 to 7000, probably indicating a wide range in the initial masses (1–3 M⊙) of their sample stars (see Table 1) rather than evidence of extra mixing: indeed the observed 17O-depleted Miras do not show the corresponding 12C- and 18O-depletion (see discussion below). They also found some stars with excess 18O (16O/18O < 500). Since these stars are younger than the Sun, these authors ascribed this fact to a galactic chemical evolution effect: 18O is a secondary element thus the 16O/18O ratio should decrease with time (increasing metallicity).
It is evident that the situation outlined above concerning the existence of non-standard mixing processes during the AGB is far from conclusive. This is in part due to the existing inhomogeneous observational data coming from different analyses using different techniques. In this study we have attempted to elucidate this situation through a joint analysis and discussion of the CNO isotopic ratios derived in AGB carbon stars in a homogeneous way. To do that we have redetermined oxygen isotopic ratios in a sample of Galactic carbon stars, many of them already studied by H87. The results are discussed together with the carbon and nitrogen isotopic ratios in the same stars derived previously using equal spectral analysis tools. In the following sections we discuss the analysis of the infrared spectra used to derive the oxygen ratios and then discuss all CNO isotopic ratios in the framework of the state-of-the-art of stellar and nucleosynthesis models for AGB stars with and without RGB and/or AGB extra mixing.
2. Observations and analysis
The spectra used here were drawn entirely from the archives of the Kitt Peak National Observatory (KPNO) 4 m Mayall Telescope Fourier Transform Spectrometer (FTS) or kindly provided by K. Hinkle. This material has been extensively used in the literature for different purposes. Our analysis is based on 2.3 μm spectra, in which lines due to Δv = 2 transition in the CO molecule’s ground electronic state are present. Indeed, many lines of the species 12C16,17,18O can be identified allowing the determination of the oxygen isotope ratios. At ~ 2.3μm these spectra have a resolving power of R ~ 50 000. Details on spectral reduction, calibration, and cleaning from telluric lines can be seen in Lambert et al. (1986) and H87 (or in Hinkle et al. 2016, for a recent summary), and will not be repeated here.
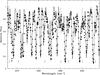 |
Fig. 1 Comparison of observed (dots) and synthetic spectra for Z Psc (N-type). Synthetic spectrum calculated with a 16O/17O ratio 650 (continuous line). Synthetic spectra computed without 17O and with 16O/17O of 350, respectively (dotted lines). The position of some 12C17O blends are marked with vertical lines. |
To perform a homogeneous analysis, we used the stellar parameters (Teff, gravity, metallicities, microturbulence and C/O) previously derived in our analysis of the fluorine abundances and the 14N/15N ratios in the same stars (Abia et al. 2010, 2015; Hedrosa et al. 2013). Of particular relevance is the determination of the CNO abundances. Carbon and oxygen abundances were derived from a few weak, unblended C2 and CO lines in the 2.3 μm region. For most of the stars, nitrogen abundances were derived from CN lines using very high-resolution spectra in the ~ 8000 Å region (see Hedrosa et al. 2013, for details). Once the nitrogen abundance was determined, carbon and oxygen abundances were again redetermined from the 2.3μm region in an iterative process until convergence was achieved. In the stars with no spectrum in the 8000 Å region, we assumed the solar nitrogen abundance according to Asplund et al. (2009). In any case, the nitrogen abundance has a minor role on the derivation of the 16O/17O/18O ratios. AGB carbon stars show typically solar nitrogen abundances (Lambert et al. 1986). Updated atomic and molecular line lists were used in both spectral regions (see Hedrosa et al. 2013; Abia et al. 2010, 2015, for details). A significant change with respect to the line lists used in previous works is the updated CN line list. Furthermore, we have included the contribution from the HCN molecule (H12CN/H13CN) according to the computations by Harris et al. (2003). This molecule has some contribution by introducing a global extra absorption (veil) that might diminish the spectral continuum by up to ~2–3%. Careful selection of the 12C17,18O lines in the 2.3 μm region was performed; in particular, we selected only weak lines not significantly affected by blends, and sensitive to 17,18O abundance variations. The final list selected is shown in Table 2. Note that some of them are actually blends, which may have an impact on the accuracy of the measured ratios. In a few stars, C18O lines might be affected by telluric absorption not perfectly removed in the data reduction procedure. These lines were discarded when the 18O abundance was derived. A C-rich spherical MARCS (Gustafsson et al. 2008) model atmosphere was chosen for each star according to its stellar parameters, and synthetic local thermodynamic equillibrium spectra were calculated in the 2.3μm and 8000 Å regions, by using the Turbospectrum v14 code (Plez 2012). Theoretical spectra were convolved with a Gaussian function with the corresponding full width to medium high to mimic the spectral line profile in each range which includes the macroturbulence parameter (9–13 km s-1). We used χ2 minimization techniques to determine the oxygen ratios providing the best fit to each C17,18O feature. The goal was to fit not only the selected lines, but also the overall shape of the spectra. The final estimates of the CNO abundances agree well with the results obtained by Abia et al. (2010) and Hedrosa et al. (2013) and may be taken as confirming them. The oxygen isotopic ratios derived from individual features were then combined to obtain an average. The number of spectral features used in each star to obtain the oxygen isotope ratios is given in Table 3.
Spectroscopic parameters of the CO lines used.
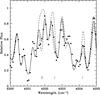 |
Fig. 2 Comparison of observed (dots) and synthetic spectra for FU Mon (SC-type). The continuous line represents the synthetic spectrum calculated with a 16O/18O ratio of 400. Dashed lines represent synthetic spectra computed without 18O and with 16O/18O of 200, respectively. The position of some 12C18O blends are marked with vertical lines. Note that some spectral features are not well reproduced by the synthetic spectra. |
Figures 1 to 3 show examples of synthetic fits to observational spectra in the 2.3 μm region. Note that some spectral features are not well reproduced by the theoretical spectra in particular in the region where the C18O features are present. Most of these lines are 12C16O absorptions, which may indicate that our line list is not yet complete. This certainly has a deleterious effect on the accuracy of measured 16O/18O ratios.
The derived oxygen ratios are affected by a number of uncertainty sources. In particular the uncertainty in the C/O ratio because it has an important effect on the opacities in the model atmosphere. In fact, a typical uncertainty ΔC/O = ± 0.02 introduces an error in the oxygen ratios of ~ 20%. The most important source of error is, however, the oxygen abundance. A change of ± 0.3 dex in the [O/H] ratio may change the derived isotope ratios by up to 35%. Also, due to the almost saturation of the C17,18O lines used, the assumed microturbulence (~ 2.3 km s-1) has an impact: a change of Δξ = ± 0.3 km s-1 modifies the oxygen ratios by ~ 15%. On the contrary, changes of ± 200 K in the adopted effective temperature modifies the 16O/17O/18O ratios by only a few percent. Errors due to uncertainties in other model atmosphere parameters (gravity, metallicity, or nitrogen abundance) are even smaller. However, the estimate of the total error is more complex than the simple quadratic addition of all these errors, because most of the stellar parameters are coupled to at least one of the others. For instance, a change within the quoted uncertainty in the adopted Teff would change the oxygen ratios derived by a certain amount, but the resulting fit to the global spectrum might not be acceptable. Therefore, such a variation in the Teff value should be discarded. In other words, the co-variance terms in the estimate of the total error have to be taken into account. In our case, and given the inter-dependence between the stellar parameters, this is rather complex to estimate. To take this into account, a procedure designed by Cayrel et al. (2004) was followed. Briefly, for a typical star in the sample, a synthetic spectrum is computed by modifying a stellar parameter in an amount according to its assumed uncertainty. Then, all the other stellar parameters are changed within their uncertainties until a good fit to the global spectrum is found. The difference between the oxygen ratios derived using the first (best) adopted set of stellar parameters and those derived with the new set of “good” stellar parameters may give an estimate of the real uncertainty. The total error would then be that of the largest difference in the oxygen ratios obtained with the different combinations of the stellar parameters. We have performed this analysis for several stars in the sample. The error estimated in this way, added quadratically with that due to the uncertainty in the continuum position (~ 2%) and the dispersion in the isotope ratios when derived from different lines (see Table 3), would give an estimate of the total error. This ranges from 250 to 350 and 360 to 550 for the 16O/17O and 16O/18O ratios, respectively (the larger the derived ratio the larger the total error). For J-type stars, the total uncertainty would be higher because synthetic fits to the observed spectra are, in general, of worse quality. In fact, for some of these stars, we set only upper limits to the 18O abundance.
Now we compare our results with previous estimates of the oxygen isotope ratios in the literature. Most of our stars are in common with H87. We find systematically lower 16O/17O and 16O/18O ratios compared with these authors by −225 ± 500 and −500 ± 620, respectively. This figure is found for all carbon stars types. We verified that differences in the stellar parameters adopted for a specific star are not enough to explain the discrepancy in the measured ratios. Differences in the model atmospheres used cannot account for this systematic difference either. In fact, in our analysis the atmosphere models used by H87 would imply the derivation of higher oxygen isotopic ratios. H87 adopted the stellar parameters derived in Lambert et al. (1986) and used an old grid of unpublished C-rich atmosphere models (see also Lambert et al. 1986). Thus, we believe that the main reason of the discrepancy is in the difference between the molecular line lists used, in particular for the CO and CN molecules. In H87 the CO molecular constant of Dale et al. (1979) and the log gf values of Chackerian & Tipping (1983) were employed. Unfortunately, we cannot confirm this because H87 do not indicate the specific C17,18O lines used in their analysis. On the other hand, we have four stars in common with Dominy et al. (1986), all of them of SC-type: GP Ori, FU Mon, CY Cyg and RZ Peg. The 16O/17O ratios derived by these authors are systematically lower than our values, although in FU Mon and CY Cyg they agree within the error bars. Nevertheless, the reason for the discrepancy is completely due to the systematically lower Teff values adopted (up to 500 K) by Dominy et al. (1986) compared to ours. Finally, we have few stars in common with the recent work by Hinkle et al. (2016). The ratios derived in the stars in common marginally agree within the error bars but the comparison in this case is not straightforward because these authors use the curve-of-growth method in the analysis instead of the spectral synthesis used here.
Carbon, nitrogen, and oxygen isotopic ratios for AGB carbon stars.
3. Results and discussion
Table 3 shows the oxygen isotopic ratios derived in our sample of AGB carbon stars. The number in parentheses indicates the dispersion around the mean value when more than two 12C17,18O lines were used. The table also shows the carbon and nitrogen isotope ratios derived for the same stars. In some stars the carbon isotope ratio shown is that from Lambert et al. (1986) as our re-analysis here find only minor differences in this ratio. Note that all the CNO isotope ratios have been derived using a homogeneous set of stellar parameters and spectral analysis tools. Therefore, to our knowledge, they constitute the first homogeneous sample of CNO isotopic ratios measured in carbon stars. The two oxygen ratios derived cover a similar range:  O/17O ≤ 1800 and
  O/18O ≤ 1600, being less wide than those found by H87. For N-type stars the average ratios are 16O/17O = 1057 ± 460 and 16O/18O = 870 ± 280. Considering the error bars, these average values are those theoretically predicted after the FDU for low-mass stars (see Table 1). Thus, although there are a small number of outlier stars deviating from these average values (see below), we may conclude that the oxygen ratios in normal AGB carbon stars are not significantly altered during the AGB evolution. This nicely agrees with standard AGB stellar model predictions (see e.g., Cristallo et al. 2015, and also Table 1). Interestingly, SC- and J-type stars show systematically lower 16O/17O ratios than normal N-type stars: 614 ± 140 and 435 ± 200 for SC- and J-type stars, respectively (J-type stars also showing lower 16O/18O ratios). This confirms the findings by H87 in their sample of J-type stars. SC- and J-type stars have other chemical anomalies (Li, F, 12C/13C, and 14N/15N, see Wallerstein & Knapp 1998; Abia et al. 2003, 2015, for details) to which we have now add the oxygen ratios, making these types of AGB carbon stars very peculiar ones.
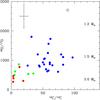 |
Fig. 4 Derived 16O/17O vs. 12C/13C ratios in the carbon stars of different spectral types: N-type (blue), SC-type (green) and J-type (red). The position of the stellar masses on the figure approximately indivcates the value of the predicted 16O/17O ratio for each mass after the FDU for solar metallicity stellar models. The operation of extra mixing on the AGB phase would place a star in the region 12C/13C < 30 and 16O/17O > 1500 (see Fig. 7). The solar ratios are marked for a guide. A typical error bar is shown. |
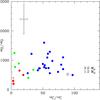 |
Fig. 5 As Fig. 4 for the derived 16O/18O vs. 12C/13C ratios. The operation of extra mixing on the AGB phase would place a star in the region 12C/13C < 30 and 16O/18O > 2000 (see Fig. 7). A typical error bar is shown. |
Figures 4 to 6 show the 16O/17O/18O vs. 12C/13C ratios found in the different types of carbon stars. Since the 12C/13C ratio increases continuously in the envelope due to the TDU episodes, this ratio may be considered as a proxy of the evolution along the AGB phase. From these figures, it is evident that no trend with the carbon ratio exists, suggesting again that the superficial oxygen ratios remain almost unaltered during the AGB evolution. In the figures, the approximate values of the oxygen ratios predicted during the AGB phase for several stellar masses at solar metallicity are also shown. Despite the large error bars, most of the observed ratios clearly lie in the range of theoretical expected values for stars within ~ 1.5–3 M⊙, in agreement with the mass range predicted for the formation of an AGB carbon star (e.g., Straniero et al. 2003; Karakas 2010; Cristallo et al. 2015). This can be better seen in Fig. 6 since theoretical predictions for the 17O/18O ratio are much more sensitive to the stellar mass. Furthermore, this ratio has a lower uncertainty because errors in the stellar parameters affect both the 16O/17O and 16O/18O ratios in the same way and cancel out when deriving the 17O/18O ratio.
Figure 4 shows, in particular, that stars of SC and J types have, on average, lower 16O/17O ratios than ordinary carbon stars, and also have very low (<30) 12C/13C. As mentioned in Sect. 1, carbon ratios ≤30 in carbon stars are difficult to explain by AGB standard models. On the other hand, two N-type stars (TU Gem and Y Tau) have high 16O/17O but normal 12C/13C. In Fig. 5, some N-type stars also show a large 16O/18O > 1000 ratio. These large 16O/17O ratios cannot be explained by standard AGB models either and might require a non-standard mixing process. Such large ratios in the AGB phase would be expected, nevertheless, in stars with initial masses between ~ 1.1 and 1.3 M⊙ at solar metallicity (see Table 1). For such low stellar masses however, the envelope is so small that TDUs are very inefficient and the stars would never become a carbon star, which is against the evidence derived for our stars. Note however, that the derived 17O/18O ratio (with a lower uncertainty) in these two N-type stars, is compatible with theoretical predictions for stars with M ≥ 1.5 M⊙ (see Table 1 and Fig. 6).
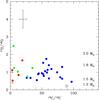 |
Fig. 6 As Fig. 4 for the derived 17O/18O vs. 12C/13C ratios. Note the extreme sensitivity of the 17O/18O to the stellar mass after the FDU. Most of the measured ratios lie within the values expected for masses 1.5–3 M⊙. The existence of extra mixing on the AGB phase would place any star in the region 12C/13C < 30 and 17O/18O > 4. A typical error bar is shown. |
3.1. Comparison with theoretical low-mass AGB stellar models
As mentioned in Sect. 1, it is generally accepted that the FDU alone cannot account for the CNO isotope ratios measured in RGB stars with M < 2 M⊙ and that an extra mixing process must be at work in the upper RGB. In particular, the 12C/13C ratio in these stars is substantially lower than predicted by stellar models after the occurrence of the FDU. Values of 12C/13C < 20 are commonly found in low-mass RGB stars brighter than the so-called RGB bump. The observed carbon ratios are even lower than approximately ten in metal-poor RGB stars. In principle, also nitrogen and oxygen ratios may be altered by extra mixing in RGB stars, although there is little observational evidence of this (see e.g., Abia et al. 2012). On the other hand, the existence of extra mixing in AGB stars is still under discussion (see Sect. 1). The actual physical process capable to drive efficient mixing below the convective envelope in giant stars is still largely unknown. In any case, to explore this possibility we have constructed AGB evolutionary models including extra mixing using the latest release of the FUNS code (Straniero et al. 2006; Piersanti et al. 2013) for two representative stellar masses (1.5 and 2 M⊙ with Z = 0.014, Y = 0.27). Except for the 17O(p,α)14N (Bruno et al. 2016), all the rates of the other reactions involved in the H burning are from Adelberger et al. (2011). The various uncertainties affecting stellar models and the related nucleosynthesis results, including those due to the treatment of mixing, are discussed in Straniero et al. (2014). We have assumed solar initial CNO ratios. Despite the fact that our stars are considerably younger than the Sun, current observations in the local ISM show average CNO ratios compatible with the solar ones, albeit with a significant dispersion (Milam et al. 2005; Adande & Ziurys 2012; Ritchey et al. 2015; Nittler & Gaidos 2012).
Then the idea is to study the effects of the extra mixing models on the CNO isotope ratios and compare the results with the observed ones exploiting the fact that we have measured the three isotope ratios in some of our stars. We have modeled this following the procedure in Nollett et al. (2003). Starting from the RGB-bump, we have switched on an artificial extra mixing process extending from the convective boundary down to an assumed maximum temperature Tmax (see Domínguez et al. 2004, for details). The mixing velocity has been set to 100 cm/s, which is of the same order of magnitude as the velocity estimated for thermohaline mixing (see e.g., Lattanzio et al. 2015) and magnetic buoyancy (Nucci & Busso 2014), while it is an order of magnitude larger than that expected for rotational induced mixing (Zahn 2013). We checked that the CNO isotopic ratios at the stellar surface do not depend on the assumed mixing velocity within a reasonable range, but mainly on Tmax. Extra mixing processes have been activated from the RGB bump to the RGB tip (Tmax = 22 MK). In this parametrized extra mixing model, we have assumed that the Tmax = 22 MK remains constant up to the RGB tip. This maximum temperature approximately corresponds to the temperature of the envelope/core interface at the epoch of the RGB bump. Later on, however, the H-burning shell becomes hotter and one may suppose that Tmax could be larger. In that case a lower 12C/13C would be attained at the RGB tip. Figure 7 shows the evolution of the main CNO abundances and isotope ratios along the RGB and AGB phases for the 1.5 (black line) and 2 M⊙ (red line) models. For clarity, the evolutionary timescale (horizontal axis) has been re-scaled to the final time in the computation tf, namely, 2.91 and 1.196 Gyr for the 1.5 and 2 M⊙ models, respectively. The FDU occurs at log t/ (t−tf) ~ 0.8 (1.5 M⊙) and 0.6 (2 M⊙), while the RGB bump takes place at log t/ (t−tf) ~ 1.2 and 0.9, respectively. The 12C depletion and the corresponding 14N enhancement are clearly shown as well as the decreases of the 12C/13C, C/O, and C/N ratios. The effect of the 17O enhancement on the 16O/17O ratio is also evident. Due to the large vertical scale, the increase of 14N/15N and 16O/18O ratios, as caused by the FDU, is less evident.
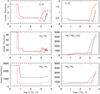 |
Fig. 7 Evolution up to the AGB tip of C, N, and O elemental and isotopic ratios in models with 1.5 M⊙ (black line) and 2 M⊙ (red line). The first dredge up occurs at log t/ (t−tf) ~ 0.9 (1.5 M⊙) and 0.6 (2 M⊙), while the RGB bump takes place at log t/ (t−tf) ~ 1.2 and 0.8, respectively. The combined actions of the third dredge up and the AGB extra mixing arise at log t/ (t−tf) > 3.2 and 2.8. Note the reduced scale in the 14N/15N ratio. |
In addition to the RGB extra mixing, an AGB extra mixing extending down to Tmax = 40 MK has been activated since the first thermal pulse to the AGB tip. This can be seen in Fig. 7 near log t/ (tf−t) ~ 3. Due to extra mixing the star now needs more TDU events to become a carbon star (C/O > 1) than in the standard case. This has a dramatic effect on the 12C/13C ratio in the envelope which is kept below ~ 30 throughout the AGB phase (see Fig. 7). This result is well known: to explain the low 12C/13C ratios measured in a non-negligible fraction of Galactic AGB carbon stars, extra mixing both in the RGB and AGB phases is needed (see references in Sect. 1). Concerning the oxygen ratios, the 16O/17O would increase since at Tmax = 40 MK the CNO cycle equilibrium value of this ratio is approximately 1870 and, as a consequence of the AGB extra mixing, the material with such a high 16O/17O ratio in the most internal portion of the H-burning shell is mixed with the envelope material that is characterized by a low 16O/17O ratio after the FDU. This effect is weaker for the 1.5 M⊙ model, because the 16O/17O ratio after the FDU is higher (see Fig. 7). AGB extra mixing would, nevertheless, increase the 16O/17O ratio by less than a factor of two with respect to the value remaining after the FDU.
On the contrary, an AGB extra mixing would have a huge impact on the 16O/18O ratio due to the substantial 18O depletion occurring in the CNO burning region: when C/O > 1 this ratio is higher than 2000 for the two stellar models shown in Fig. 7. Furthermore, AGB carbon stars affected by extra mixing would reach extreme 14N/15N ratio values (>104, see Fig. 7 and Table 4). In summary, carbon stars with a 12C/13C ratio lower than 30 can be explained by an AGB extra mixing, but this would simultaneously imply 16O/17O > 1000, 16O/18O > 2000, and 14N/15N > 104 typically. The stars in Figs. 4 to 6 with such a low 12C/13C ratio do not show these extreme oxygen and nitrogen ratios and, vice versa, the few carbon stars in our sample with such large 16O/17O/18O and/or 14N/15N ratios (see Figs. 4 to 6 and Table 3), have normal 12C/13C ratios (>40). For these stars, there is no stellar scenario on the basis of the hydrostatic H-burning capable of explaining the measured CNO ratios. This constitutes a challenge for stellar physics. Nevertheless, a way to escape this puzzle is the possibility (although improbable) mentioned above that the stars with high O ratios have a very low mass (<1.3 M⊙). Another alternative scenario would involve the assumption that these stars were born with extremely large oxygen ratios. According to our simulations with the FUNS code initial values 16O/17O > 4000–5000 and/or 16O/18O > 1000 would be required. Despite there is a significant dispersion in these ratios at a given galactocentric radius, such large ratios are not observed in the local ISM (within ~ 1 kpc around the Sun; Wilson & Rood 1994; Kahane 1995; Nittler & Gaidos 2012). Table 4 summarizes the values of the CNO isotopic ratios reached at the main mixing events when extra mixing is included in both the RGB and AGB phases for the stellar models shown in Fig. 7.
On the other hand, we have not found any correlation between the 16O/17O/18O ratios and the neutron exposure later measured by the abundance [hs/ls] ratio (see Sect. 1). To derive the [hs/ls] ratio we have used the s-element abundances derived in many of the stars studied here according to Abia et al. (2002). This is at odds with suggestions in H87, but indeed, no such correlation is predicted by current AGB stellar models.
3.2. Carbon stars and pre-solar oxide grains
Finally, we compare the derived oxygen ratios with those in pre-solar oxide grains. In the cosmochemistry community the isotopic ratios are usually the inverse of the astronomical convention. In this section, we adopt their convention to allow comparisons to the literature data. As mentioned in Sect. 1, the majority of pre-solar oxides are believed to have formed in O-rich RGB and AGB stars. We point out that due to the intrinsic C-rich nature of our objects, a direct comparison of the oxygen ratios derived in AGB carbon stars with those in oxide grains should be avoided. However, in the standard evolutionary framework, carbon stars are the natural descendants of the O-rich AGBs (of spectral types M, MS and S). Therefore, such comparison might give some indication on whether or not the surface oxygen ratios have undergone some evolution from the O- to the C-rich phase along the AGB evolution. In fact, there is observational evidence for the presence of spectral features produced by oxide and silicate grains in the circumstellar envelopes of some intrinsic (i.e., no binaries) carbon stars (see e.g., Little & Little-Marenin 1986; Kwok & Chan 1993; Chen & Shan 2011; Guzman-Ramirez et al. 2015). These spectral features seem to have their origin in the outer O-rich shells of the circumstellar envelope formed when the star was an O-rich AGB.
Changes of the CNO isotopic ratios after the major deep mixing events including extra mixing.
Because the typical lifetime of stellar grains in the ISM is estimated to be ~ 0.5 Gyr (Jones et al. 1996), the parent stars of pre-solar grains recovered now must have ended their lives relatively shortly before the solar system formed 4.6 Gyr ago. In contrast, the AGB stars studied here are relatively young (~ 1–2 Gyr), born much later that the solar system. This means that our stars are, on average, more metal-rich than the AGB stars from which the pre-solar grains formed. As a consequence, from chemical evolution considerations (Prantzos et al. 1996), our stars should have been formed with different initial oxygen ratios than those in the progenitors of the pre-solar grains, that is, with higher than solar 17O/16O and 18O/16O ratios. Note that according to standard stellar models, oxygen ratios in the AGB phase depend mainly on values attained after the FDU, which in turn, depend on the initial oxygen ratios and stellar mass. Keeping this in mind, in Fig. 8 we compare the oxygen ratios derived for our stars with those in the oxide grains of types I and II. Also, the oxygen ratios observed in O-rich AGB stars of spectral types M, MS, and S (Smith & Lambert 1990, open circles) and in O-rich Miras (Hinkle et al. 2016, solid black circles) are shown. Excluding the upper limits set to the 18O abundance in two J-type stars (red circles), all the oxygen ratios in carbon stars lie in the range observed in the oxide grains of type I, which are believed to form in stars with 1.2 ≤ M/M⊙ ≤ 2. Note that, the range of oxygen ratios measured here are similar to those found by Smith & Lambert (1990) in O-rich AGBs. This could be interpreted as an indication of little evolution of the stellar surface ratios from the O- to the C-rich phase, in agreement with theoretical predictions. It is also apparent that they distributed in a small range, showing little spread. This is compatible with the narrow range in mass at which the formation of a carbon star is expected at solar metallicity (1.5–3 M⊙). In contrast, the large spread in the 17O/16O ratios observed in O-rich AGB stars (mainly in the Miras from Hinkle et al. 2016) agrees with the idea that these stars descend from a much wider range of initial masses (see Table 1). On the other hand, no carbon star in our sample is found with significant 18O enhancement (larger than the solar 18O/16O ratio), in contrast with that observed for the Mira stars in Hinkle et al. (2016; black dotted circles in Fig. 8). These authors interpret this figure as a clear indication of the chemical evolution in the Galaxy since the 18O/16O ratio should increase with time. However, our stars should have similar ages to those in Hinkle et al. (2016), but none of them show such 18O enhancement. This finding is difficult to understand. On the other hand, from Fig. 8 it is evident that only a few O-rich AGB stars show an 18O depletion as large as that found in oxide grains of type II (18O/16O ≪10-3). These grains are believed to form in low-mass RGB and AGB stars in which extra mixing has taken place (Wasserburg et al. 1995; Palmerini et al. 2013). As discussed before, in general the oxygen ratios found in our stars combined with the observed carbon and nitrogen ratios, leave little space for the occurrence of extra mixing, at least in ordinary N-type AGB carbon stars. Since, on average, the stars in Fig. 8 should have larger metallicity than the stars origin of the pre-solar grains, Hinkle et al. (2016) interpreted this figure as evidence that extra mixing is a rare phenomenon in metal-rich stars. The oxygen ratios derived here for AGB carbon stars support this conclusion. Obviously, more observational and theoretical studies are needed to elucidate this.
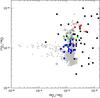 |
Fig. 8 Comparison of 17O/16O and 18O/16O ratios in AGB stars with those derived in oxide pre-solar grains of type I (gray dots) and II (gray squares) as defined by Nittler et al. (1994), taken from the database http://presolar.wustl.edu. As Fig. 1, color symbols are the AGB carbon stars analyzed here. Open black circles: O-rich AGB stars of types M, MS and S from Smith & Lambert (1990); solid black circles: O-rich Miras from Hinkle et al. (2016). Error bars in the pre-solar grains are smaller than the symbol size. Note the logarithmic scale. |
4. Conclusions
We have presented the first homogeneous analysis of carbon, nitrogen and oxygen isotope ratios in a sample of Galactic AGB carbon stars. For most of the stars, the nitrogen and oxygen ratios found are compatible with the predicted values after the occurrence of the first dredge-up suggesting that they are not significantly altered along the AGB evolution. This agrees with the predictions of standard theoretical low-mass (1.5–3 M⊙) AGB models. Furthermore, the 12C/13C ratios are typically larger than 40 as expected from the operation of the third dredge-up episodes. Some stars (mostly of J- and SC-types) showing 12C/13C < 30, would require extra mixing in both the RGB and AGB phases. However, these stars do not show the corresponding high 16O/17O (>1000), 16O/18O (>2000) and extreme 14N/15N (>104) ratios expected when extra mixing takes place. Conversely, a few carbon stars with high 16O/17O/18O do not show low 12C/13C ratios. For these stars, the observed CNO ratios cannot be explained on the basis of the hydrostatic H-burning. Globally, the derived CNO isotopic ratios would suggest that the operation of extra mixing along the AGB phase is quite a rare phenomenon, at least for solar metallicity (N-type) carbon stars.
On the other hand, the 16O/17O/18O ratios derived here are very similar to those found in pre-solar, type I oxide grains, supporting the idea that these grains were formed in AGB stars during their O-rich phase. Considering O- and C-rich AGB stars together, we find almost no stars with a 18O/16O ratio as low as those observed in oxide grains of type II. This casts some doubt on the possible formation of these pre-solar grains in AGB stars.
These limits depend on the pre-AGB phase mass loss and on the initial chemical composition.
Theoretically, the neutron exposure  , where Nn is the neutron density and vth the thermal velocity, is often used to evaluate the s-process efficiency (see Clayton 1968). Observationally, the neutron exposure can be measured from the ratio [hs/ls], where hs represent the high-mass s-elements (Ba, La, Ce, Nd, and Sm) and ls the low-mass (Sr, Zr and Y). Here we adopt the definition [A/B] = log(NA/NB) −log(NA/NB)⊙ where (NX) is the abundance by number of the element X in the scale NH ≡ 12.
Acknowledgments
Part of this work was supported by the Spanish MEC grants AYA-2011-22460 and AYA2015-63588-P within the European Founds for Regional Development (FEDER). NSO/Kitt Peak FTS data used here were produced by NSF/NOAO. Some of the data shown here are part of R. P. Hedrosa’s Ph.D. Thesis. We thank S. Cristallo and P. de Laverny for revising this Ph.D. work. ID thanks the support of the National Science Foundation under Grant No. PHY-1430152 (JINA Center for the Evolution of the Elements).
References
- Abia, C. 2011, in Why Galaxies Care about AGB Stars II: Shining Examples and Common Inhabitants, eds. F. Kerschbaum, T. Lebzelter, & R. F. Wing, ASP Conf. Ser., 445, 13 [Google Scholar]
- Abia, C., Domínguez, I., Gallino, R., et al. 2002, ApJ, 579, 817 [NASA ADS] [CrossRef] [Google Scholar]
- Abia, C., Domínguez, I., Gallino, R., et al. 2003, PASA, 20, 314 [NASA ADS] [CrossRef] [Google Scholar]
- Abia, C., Cunha, K., Cristallo, S., et al. 2010, ApJ, 715, L94 [NASA ADS] [CrossRef] [Google Scholar]
- Abia, C., Palmerini, S., Busso, M., & Cristallo, S. 2012, A&A, 548, A55 [NASA ADS] [CrossRef] [EDP Sciences] [Google Scholar]
- Abia, C., Cunha, K., Cristallo, S., & de Laverny, P. 2015, A&A, 581, A88 [NASA ADS] [CrossRef] [EDP Sciences] [Google Scholar]
- Adande, G. R., & Ziurys, L. M. 2012, ApJ, 744, 194 [NASA ADS] [CrossRef] [Google Scholar]
- Adelberger, E. G., García, A., Robertson, R. G. H., et al. 2011, Rev. Mod. Phys., 83, 195 [NASA ADS] [CrossRef] [Google Scholar]
- Amari, S., Nittler, L. R., Zinner, E., Lodders, K., & Lewis, R. S. 2001, ApJ, 559, 463 [NASA ADS] [CrossRef] [Google Scholar]
- Asplund, M., Grevesse, N., Sauval, A. J., & Scott, P. 2009, ARA&A, 47, 481 [NASA ADS] [CrossRef] [Google Scholar]
- Boeltzig, A., Bruno, C. G., Cavanna, F., et al. 2016, Eur. Phys. J. A, 52, A75 [Google Scholar]
- Brown, J. A., & Wallerstein, G. 1989, AJ, 98, 1643 [NASA ADS] [CrossRef] [Google Scholar]
- Bruno, C. G., Scott, D. A., Aliotta, M., et al. 2016, Phys. Rev. Lett., 117, 142502 [NASA ADS] [CrossRef] [PubMed] [Google Scholar]
- Busso, M., Palmerini, S., Maiorca, E., et al. 2010, ApJ, 717, L47 [NASA ADS] [CrossRef] [Google Scholar]
- Cayrel, R., Depagne, E., Spite, M., et al. 2004, A&A, 416, 1117 [NASA ADS] [CrossRef] [EDP Sciences] [Google Scholar]
- Chackerian, Jr., C., & Tipping, R. H. 1983, J. Mol. Spectr., 99, 431 [Google Scholar]
- Charbonnel, C. 2004, Origin and Evolution of the Elements, eds. A. McWilliams, & M. Rauch (Pasadena: Carnegie Observatories) 59 [Google Scholar]
- Charbonnel, C., & Lagarde, N. 2010, A&A, 522, A10 [NASA ADS] [CrossRef] [EDP Sciences] [MathSciNet] [PubMed] [Google Scholar]
- Chen, P. S., & Shan, H. G. 2011, ApJ, 732, 22 [NASA ADS] [CrossRef] [Google Scholar]
- Clayton, D. D. 1968, Principles of stellar evolution and nucleosynthesis (Mc Craw-Hill, New York), 436 [Google Scholar]
- Cristallo, S., Straniero, O., Piersanti, L., & Gobrecht, D. 2015, ApJS, 219, 40 [NASA ADS] [CrossRef] [Google Scholar]
- Dale, R. M., Herman, M., Johns, J. W. C., et al. 1979, Can. J. Phys., 57, 677 [NASA ADS] [CrossRef] [Google Scholar]
- Davis, A. M. 2011, Proc. Nat. Acad. Sci., 108, 19142 [NASA ADS] [CrossRef] [Google Scholar]
- Denissenkov, P. A., Da Costa, G. S., Norris, J. E., & Weiss, A. 1998, A&A, 333, 926 [NASA ADS] [Google Scholar]
- Domínguez, I., Abia, C., Straniero, O., Cristallo, S., & Pavlenko, Y. V. 2004, A&A, 422, 1045 [NASA ADS] [CrossRef] [EDP Sciences] [Google Scholar]
- Dominy, J. F., Wallerstein, G., & Suntzeff, N. B. 1986, ApJ, 300, 325 [NASA ADS] [CrossRef] [Google Scholar]
- Eggleton, P. P., Dearborn, D. S. P., & Lattanzio, J. C. 2006, Science, 314, 1580 [NASA ADS] [CrossRef] [PubMed] [Google Scholar]
- Gehrz, R. 1989, in Interstellar Dust, eds. L. J. Allamandola, & A. G. G. M. Tielens, IAU Symp., 135, 445 [Google Scholar]
- Goswami, A. 2014, in Thirty Meter Telescope Science Forum (Tucson Arizona), 19 [Google Scholar]
- Gratton, R. G., Sneden, C., Carretta, E., & Bragaglia, A. 2000, A&A, 354, 169 [NASA ADS] [Google Scholar]
- Grundahl, F., Briley, M., Nissen, P. E., & Feltzing, S. 2002, A&A, 385, L14 [NASA ADS] [CrossRef] [EDP Sciences] [Google Scholar]
- Gustafsson, B., Edvardsson, B., Eriksson, K., et al. 2008, A&A, 486, 951 [NASA ADS] [CrossRef] [EDP Sciences] [Google Scholar]
- Guzman-Ramirez, L., Lagadec, E., Wesson, R., et al. 2015, MNRAS, 451, L1 [NASA ADS] [CrossRef] [Google Scholar]
- Harris, M. J., Lambert, D. L., Hinkle, K. H., Gustafsson, B., & Eriksson, K. 1987, ApJ, 316, 294 [NASA ADS] [CrossRef] [Google Scholar]
- Harris, M. J., Lambert, D. L., & Smith, V. V. 1988, ApJ, 325, 768 [NASA ADS] [CrossRef] [Google Scholar]
- Harris, G. J., Pavlenko, Y. V., Jones, H. R. A., & Tennyson, J. 2003, MNRAS, 344, 1107 [NASA ADS] [CrossRef] [Google Scholar]
- Hedrosa, R. P., Abia, C., Busso, M., et al. 2013, ApJ, 768, L11 [NASA ADS] [CrossRef] [Google Scholar]
- Hinkle, K. H., Lebzelter, T., & Straniero, O. 2016, ApJ, 825, 38 [NASA ADS] [CrossRef] [Google Scholar]
- Huss, G. R., Hutcheon, I. D., Wasserburg, G. J., & Stone, J. 1992, in 23rd Lunar and Planetary Science Conference, LPI Contributions, 781, 29 [NASA ADS] [Google Scholar]
- Iben, Jr., I., & Renzini, A. 1983, ARA&A, 21, 271 [NASA ADS] [CrossRef] [Google Scholar]
- Jones, A. P., Tielens, A. G. G. M., & Hollenbach, D. J. 1996, ApJ, 469, 740 [NASA ADS] [CrossRef] [Google Scholar]
- Kahane, C. 1995, in Nuclei in the Cosmos III, eds. M. Busso, C. M. Raiteri, & R. Gallino, AIP Conf. Ser., 327, 19 [Google Scholar]
- Karakas, A. I. 2010, MNRAS, 403, 1413 [NASA ADS] [CrossRef] [Google Scholar]
- Karakas, A. I., & Lattanzio, J. C. 2014, PASA, 31, e030 [NASA ADS] [CrossRef] [Google Scholar]
- Karakas, A. I., Campbell, S. W., & Stancliffe, R. J. 2010, ApJ, 713, 374 [NASA ADS] [CrossRef] [Google Scholar]
- Kwok, S., & Chan, S. J. 1993, AJ, 106, 2140 [NASA ADS] [CrossRef] [Google Scholar]
- Lambert, D. L., Gustafsson, B., Eriksson, K., & Hinkle, K. H. 1986, ApJS, 62, 373 [NASA ADS] [CrossRef] [Google Scholar]
- Lattanzio, J. C., Siess, L., Church, R. P., et al. 2015, MNRAS, 446, 2673 [NASA ADS] [CrossRef] [Google Scholar]
- Lebzelter, T., Lederer, M. T., Cristallo, S., et al. 2008, A&A, 486, 511 [NASA ADS] [CrossRef] [EDP Sciences] [Google Scholar]
- Lebzelter, T., Straniero, O., Hinkle, K. H., Nowotny, W., & Aringer, B. 2015, A&A, 578, A33 [NASA ADS] [CrossRef] [EDP Sciences] [Google Scholar]
- Little, S. J., & Little-Marenin, I. R. 1986, in Cool Stars, Stellar Systems and the Sun, eds. M. Zeilik, & D. M. Gibson (Berlin Springer Verlag), Lect. Notes Phys., 254, 423 [Google Scholar]
- Lodders, K., & Palme, H. 2009, Met. Planet. Sci. Suppl., 72, 5154 [Google Scholar]
- Marty, B., Chaussidon, M., Wiens, R. C., Jurewicz, A. J. G., & Burnett, D. S. 2011, Science, 332, 1533 [NASA ADS] [CrossRef] [Google Scholar]
- Milam, S. N., Savage, C., Brewster, M. A., Ziurys, L. M., & Wyckoff, S. 2005, ApJ, 634, 1126 [NASA ADS] [CrossRef] [Google Scholar]
- Milam, S. N., Woolf, N. J., & Ziurys, L. M. 2009, ApJ, 690, 837 [NASA ADS] [CrossRef] [Google Scholar]
- Nittler, L. R., & Gaidos, E. 2012, Meteoritics and Planetary Science, 47, 2031 [NASA ADS] [CrossRef] [Google Scholar]
- Nittler, L. R., O’D Alexander, C. M., Gao, X., Walker, R. M., & Zinner, E. K. 1994, Nature, 370, 443 [NASA ADS] [CrossRef] [Google Scholar]
- Nittler, L. R., Alexander, C. M. O., Gallino, R., et al. 2008, ApJ, 682, 1450 [NASA ADS] [CrossRef] [Google Scholar]
- Nollett, K. M., Busso, M., & Wasserburg, G. J. 2003, ApJ, 582, 1036 [Google Scholar]
- Nordhaus, J., Busso, M., Wasserburg, G. J., Blackman, E. G., & Palmerini, S. 2008, ApJ, 684, L29 [NASA ADS] [CrossRef] [Google Scholar]
- Nucci, M. C., & Busso, M. 2014, ApJ, 787, 141 [NASA ADS] [CrossRef] [Google Scholar]
- Olofsson, H., Eriksson, K., Gustafsson, B., & Carlstrom, U. 1993, ApJS, 87, 267 [NASA ADS] [CrossRef] [Google Scholar]
- Palmerini, S., La Cognata, M., Cristallo, S., & Busso, M. 2011, ApJ, 729, 3 [NASA ADS] [CrossRef] [Google Scholar]
- Palmerini, S., Sergi, M. L., La Cognata, M., et al. 2013, ApJ, 764, 128 [Google Scholar]
- Piersanti, L., Cristallo, S., & Straniero, O. 2013, ApJ, 774, 98 [NASA ADS] [CrossRef] [Google Scholar]
- Plez, B. 2012, Turbospectrum: Code for spectral synthesis (Astrophysics Source Code Library) [Google Scholar]
- Prantzos, N., Aubert, O., & Audouze, J. 1996, A&A, 309, 760 [NASA ADS] [Google Scholar]
- Ritchey, A. M., Federman, S. R., & Lambert, D. L. 2015, ApJ, 804, L3 [NASA ADS] [CrossRef] [Google Scholar]
- Smith, V. V., & Lambert, D. L. 1990, ApJS, 72, 387 [NASA ADS] [CrossRef] [Google Scholar]
- Smith, V. V., & Suntzeff, N. B. 1989, AJ, 97, 1699 [NASA ADS] [CrossRef] [Google Scholar]
- Straniero, O., Domínguez, I., Cristallo, S., & Gallino, R. 2003, PASA, 20, 389 [NASA ADS] [CrossRef] [Google Scholar]
- Straniero, O., Gallino, R., & Cristallo, S. 2006, Nucl. Phys. A, 777, 311 [NASA ADS] [CrossRef] [Google Scholar]
- Straniero, O., Cristallo, S., & Piersanti, L. 2014, ApJ, 785, 77 [NASA ADS] [CrossRef] [Google Scholar]
- Ventura, P., Karakas, A. I., Dell’Agli, F., et al. 2015, MNRAS, 450, 3181 [NASA ADS] [CrossRef] [Google Scholar]
- Wallerstein, G., & Knapp, G. R. 1998, ARA&A, 36, 369 [NASA ADS] [CrossRef] [Google Scholar]
- Wasserburg, G. J., Boothroyd, A. I., & Sackmann, I. 1995, ApJ, 447, L37 [NASA ADS] [CrossRef] [Google Scholar]
- Weiss, A., Denissenkov, P. A., & Charbonnel, C. 2000, A&A, 356, 181 [NASA ADS] [Google Scholar]
- Wilson, T. L., & Rood, R. 1994, ARA&A, 32, 191 [NASA ADS] [CrossRef] [Google Scholar]
- Zahn, J.-P. 2013, in EAS Pub. Ser., 63, eds. G. Alecian, Y. Lebreton, O. Richard, & G. Vauclair, 245 [Google Scholar]
All Tables
Predicted CNO ratios (by number) after the FDU at solar metallicity (Z = 0.014, Y = 0.27).
Changes of the CNO isotopic ratios after the major deep mixing events including extra mixing.
All Figures
|
Fig. 1 Comparison of observed (dots) and synthetic spectra for Z Psc (N-type). Synthetic spectrum calculated with a 16O/17O ratio 650 (continuous line). Synthetic spectra computed without 17O and with 16O/17O of 350, respectively (dotted lines). The position of some 12C17O blends are marked with vertical lines. |
| In the text | |
|
Fig. 2 Comparison of observed (dots) and synthetic spectra for FU Mon (SC-type). The continuous line represents the synthetic spectrum calculated with a 16O/18O ratio of 400. Dashed lines represent synthetic spectra computed without 18O and with 16O/18O of 200, respectively. The position of some 12C18O blends are marked with vertical lines. Note that some spectral features are not well reproduced by the synthetic spectra. |
| In the text | |
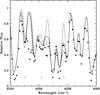 |
Fig. 3 As Fig. 2 for FU Mon in the vicinity of the 12C18O 2–0 band-head. |
| In the text | |
|
Fig. 4 Derived 16O/17O vs. 12C/13C ratios in the carbon stars of different spectral types: N-type (blue), SC-type (green) and J-type (red). The position of the stellar masses on the figure approximately indivcates the value of the predicted 16O/17O ratio for each mass after the FDU for solar metallicity stellar models. The operation of extra mixing on the AGB phase would place a star in the region 12C/13C < 30 and 16O/17O > 1500 (see Fig. 7). The solar ratios are marked for a guide. A typical error bar is shown. |
| In the text | |
|
Fig. 5 As Fig. 4 for the derived 16O/18O vs. 12C/13C ratios. The operation of extra mixing on the AGB phase would place a star in the region 12C/13C < 30 and 16O/18O > 2000 (see Fig. 7). A typical error bar is shown. |
| In the text | |
|
Fig. 6 As Fig. 4 for the derived 17O/18O vs. 12C/13C ratios. Note the extreme sensitivity of the 17O/18O to the stellar mass after the FDU. Most of the measured ratios lie within the values expected for masses 1.5–3 M⊙. The existence of extra mixing on the AGB phase would place any star in the region 12C/13C < 30 and 17O/18O > 4. A typical error bar is shown. |
| In the text | |
|
Fig. 7 Evolution up to the AGB tip of C, N, and O elemental and isotopic ratios in models with 1.5 M⊙ (black line) and 2 M⊙ (red line). The first dredge up occurs at log t/ (t−tf) ~ 0.9 (1.5 M⊙) and 0.6 (2 M⊙), while the RGB bump takes place at log t/ (t−tf) ~ 1.2 and 0.8, respectively. The combined actions of the third dredge up and the AGB extra mixing arise at log t/ (t−tf) > 3.2 and 2.8. Note the reduced scale in the 14N/15N ratio. |
| In the text | |
|
Fig. 8 Comparison of 17O/16O and 18O/16O ratios in AGB stars with those derived in oxide pre-solar grains of type I (gray dots) and II (gray squares) as defined by Nittler et al. (1994), taken from the database http://presolar.wustl.edu. As Fig. 1, color symbols are the AGB carbon stars analyzed here. Open black circles: O-rich AGB stars of types M, MS and S from Smith & Lambert (1990); solid black circles: O-rich Miras from Hinkle et al. (2016). Error bars in the pre-solar grains are smaller than the symbol size. Note the logarithmic scale. |
| In the text | |
Current usage metrics show cumulative count of Article Views (full-text article views including HTML views, PDF and ePub downloads, according to the available data) and Abstracts Views on Vision4Press platform.
Data correspond to usage on the plateform after 2015. The current usage metrics is available 48-96 hours after online publication and is updated daily on week days.
Initial download of the metrics may take a while.