Fig. 7
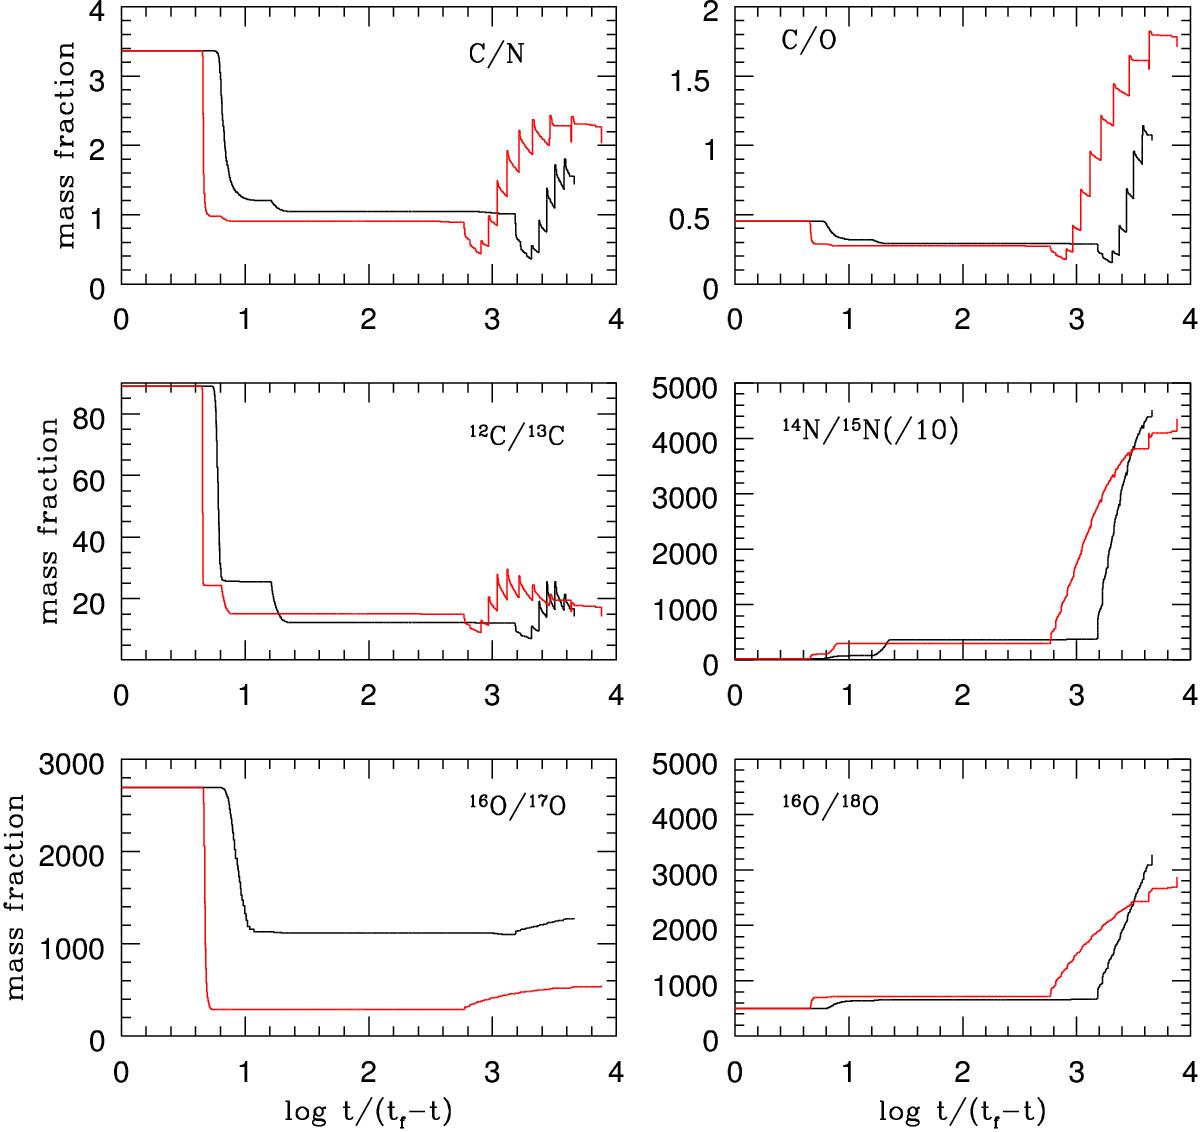
Evolution up to the AGB tip of C, N, and O elemental and isotopic ratios in models with 1.5 M⊙ (black line) and 2 M⊙ (red line). The first dredge up occurs at log t/ (t−tf) ~ 0.9 (1.5 M⊙) and 0.6 (2 M⊙), while the RGB bump takes place at log t/ (t−tf) ~ 1.2 and 0.8, respectively. The combined actions of the third dredge up and the AGB extra mixing arise at log t/ (t−tf) > 3.2 and 2.8. Note the reduced scale in the 14N/15N ratio.
Current usage metrics show cumulative count of Article Views (full-text article views including HTML views, PDF and ePub downloads, according to the available data) and Abstracts Views on Vision4Press platform.
Data correspond to usage on the plateform after 2015. The current usage metrics is available 48-96 hours after online publication and is updated daily on week days.
Initial download of the metrics may take a while.