Fig. 2
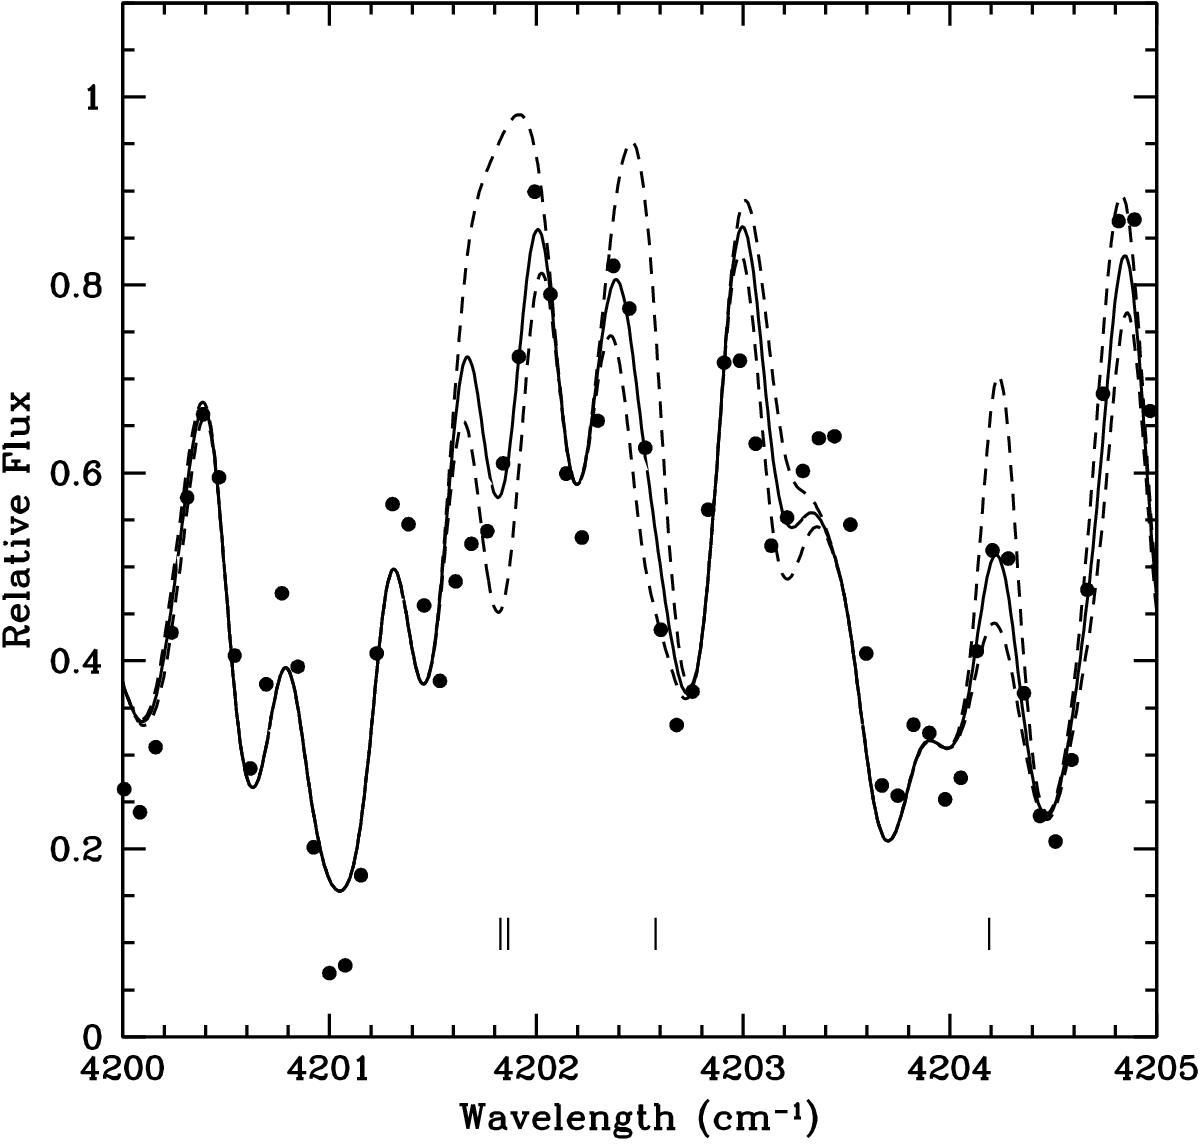
Comparison of observed (dots) and synthetic spectra for FU Mon (SC-type). The continuous line represents the synthetic spectrum calculated with a 16O/18O ratio of 400. Dashed lines represent synthetic spectra computed without 18O and with 16O/18O of 200, respectively. The position of some 12C18O blends are marked with vertical lines. Note that some spectral features are not well reproduced by the synthetic spectra.
Current usage metrics show cumulative count of Article Views (full-text article views including HTML views, PDF and ePub downloads, according to the available data) and Abstracts Views on Vision4Press platform.
Data correspond to usage on the plateform after 2015. The current usage metrics is available 48-96 hours after online publication and is updated daily on week days.
Initial download of the metrics may take a while.