Fig. 7
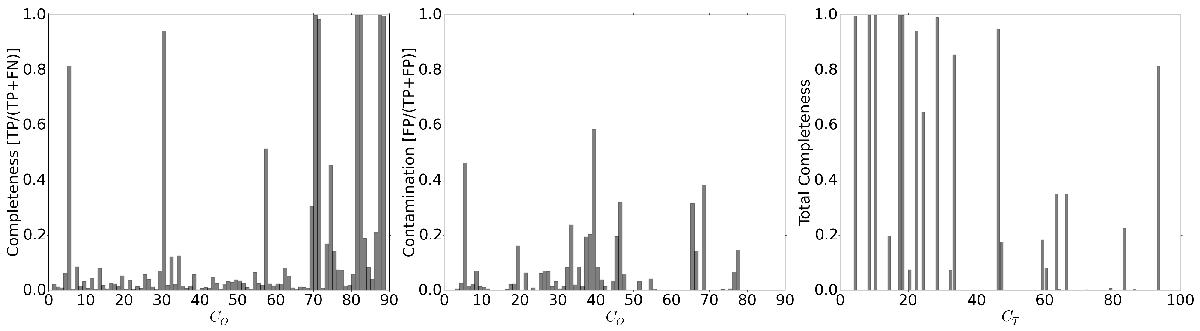
Left-hand panel: completeness of each cluster CO extracted by OPTICS with respect to the original cluster CT given by Bullock & Johnston (2005). The low values are because many streams experienced a tidal breakup, and the individual partitions detected by OPTICS were compared with the entire stream size. Right-hand panel: what fraction of true clusters show up in any cluster extracted by OPTICS. Many overdensities are recovered with a large total completeness. Some of the low total completeness values come from clusters that are so sparse compared to the background that they are difficult to distinguish. The middle panel shows the contamination in each cluster extracted by OPTICS.
Current usage metrics show cumulative count of Article Views (full-text article views including HTML views, PDF and ePub downloads, according to the available data) and Abstracts Views on Vision4Press platform.
Data correspond to usage on the plateform after 2015. The current usage metrics is available 48-96 hours after online publication and is updated daily on week days.
Initial download of the metrics may take a while.