Fig. 4
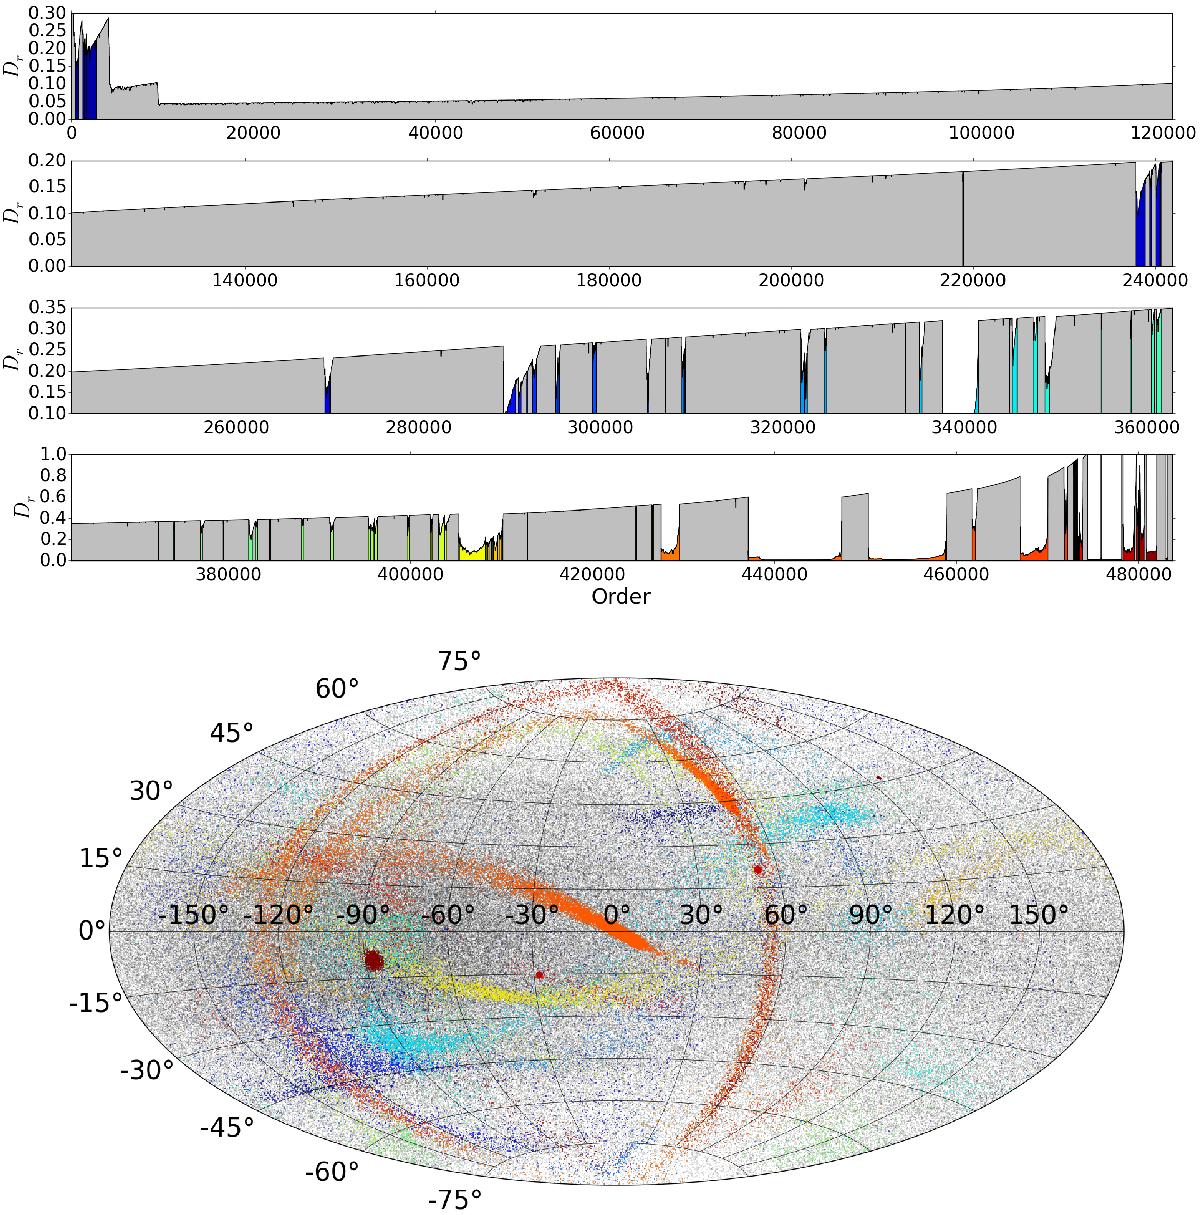
Top panel: reachability diagram produced by OPTICS when clustering the down-scaled Halo-02 sample. As per definition, the x-axis represents the processing order derived from OPTICS and the y-axis gives the normalized reachability (Dr) where dr has been normalized to the highest defined value and all undefined values set to one. Bottom panel: Aitoff projection of objects used in the clustering of Halo-02. Each extracted cluster was color coded to show its location in both the reachability diagram and the Aitoff projection. Comparing Fig. 3 and the Aitoff projection presented here it is clear that OPTICS recovers all of the clusters that are visible by eye. More importantly, OPTICS is able to disentangle clusters that appear to overlap in their Aitoff projections.
Current usage metrics show cumulative count of Article Views (full-text article views including HTML views, PDF and ePub downloads, according to the available data) and Abstracts Views on Vision4Press platform.
Data correspond to usage on the plateform after 2015. The current usage metrics is available 48-96 hours after online publication and is updated daily on week days.
Initial download of the metrics may take a while.