| Issue |
A&A
Volume 599, March 2017
|
|
|---|---|---|
| Article Number | A77 | |
| Number of page(s) | 8 | |
| Section | Interstellar and circumstellar matter | |
| DOI | https://doi.org/10.1051/0004-6361/201629256 | |
| Published online | 02 March 2017 | |
Jets of SS 433 on scales of dozens of parsecs
Institute of Mathematics, Physics and Information Technologies (IMFIT), Togliatti State University, Belorusskaya 14, 445667 Togliatti, Russia
e-mail: This email address is being protected from spambots. You need JavaScript enabled to view it.
Received: 6 July 2016
Accepted: 10 December 2016
Abstract
Context. The radio nebula W 50 harbours the relativistic binary system SS 433, which is a source of powerful wind and jets. The origin of W 50 is wrapped in the interplay of the wind, supernova remnant, and jets. The evolution of the jets of SS 433 on the scale of the nebula W 50 is a Rosetta stone for its origin.
Aims. To disentangle the roles of these components, we study the physical conditions of the propagation of the jets of SS 433 inside W 50 and determine the deceleration of the jets.
Methods. We analysed the morphology and parameters of the interior of W 50 using the available observations of the eastern X-ray lobe, which trace the jet. In order to estimate deceleration of this jet, we devised a simplistic model of the viscous interaction of a jet, via turbulence, with the ambient medium. This model fits mass entrainment from the ambient medium into the jets of the radio galaxy 3C 31, the well-studied case of continuously decelerating jets.
Results. X-ray observations suggest that the eastern jet is hollow, persists through W50, and is recollimated to the opening angle of ~30°. From the thermal emission of the eastern X-ray lobe, we determine a pressure of P ~ 3 × 10-11 erg/cm3 inside W 50. In the frame of a theory of the dynamics of radiative supernova remnants and stellar wind bubbles, in combination with other known parameters this pressure restricts the origin of W 50 to a supernova occuring ~100 000 yr ago. Also, this pressure in our entrainment model gives a deceleration of the jet by ~60% in the bounds of the spherical component of W 50, of radius ~40 pc. In this case, the age of the jet should be ≪27 000 yr so as to satisfy the sphericity of W 50. The entrainment model comes to the viscous stress in a jet of a form σ = αP, where the viscosity parameter α is predefined by the model.
Key words: ISM: bubbles / ISM: supernova remnants / ISM: individual objects: W50 / X-rays: individuals: W50 / ISM: jets and outflows / turbulence
© ESO, 2017
1. Introduction
Astrophysical jets derive a significant part of their energy from accretion disks and radically influence their environment. The powerful jets of SS 433 (Abell & Margon 1979) are so intimately interconnected with the surrounding shell-type radio nebula W 50 that the nebula is thought to be not entirely of supernova origin. These jets are radiatively inefficient, which suggests that their huge kinetic energy, of flux Lj0 ~ 1039 erg/s, transforms into the thermal and mechanical energies of W 50. The gamma-ray emission revealed by Bordas et al. (2015), located within the W 50 area, points to one more element in the energy losses of the jets: up to 10s of percent of the jets energy might transform into relativistic particles. Moreover, this may indicate a region, where the jets decelerate and transmit energy to the nebula, in the interior of W 50, rather than at the nebula shell.
The role of the jets of SS 433 in the formation of the peculiar W 50 is unknown (see Farnes et al. 2016, for a comprehensive review of the origin of W 50). The radio morphology of W 50 closely resembles an achatina, the giant African snail (Dubner et al. 1998; see also Fig. 1). W 50 looks like it consists of coils, narrowing to the tips of the nebula like a pyramid. The torque and elongated appearance of W 50 might be due to the jets, which, however, are not explicitly resolved at the scales of W 50 (1° × 2°). By convention, one discerns in W 50 a spherical component of radius ~29′ (Dubner et al. 1998) and two protrusions, the so-called ears.
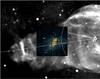 |
Fig. 1 Image in 1–2 keV of the bright knot region (the XMM-Newton observatory), laid over W 50 radio image (Dubner et al. 1998), depicts the geometry of the eastern X-ray lobe in hard emission. The images are given at the epoch J2000, north is up, east is left, and SS 433 (RA = 19h11m49.s57, Dec = 04°58′57.′′9) is on the right. The spherical component of W 50, precession cone and its axis, ticked every 15′ from the beginning at SS 433 are indicated. The borders of the Watson et al. (1983) cut, for the radial profile of brightness, are delineated by arrows. |
W 50 is elongated along the jets, which are observed close to SS 433 as outflows in X-ray, optical, and radio bands. At distances from the source of the jets up to ~6′′, or at distances r ≲ 0.13 pc1, the jets show a regular precession with period 162.250 days, under angle 19.°75, around an axis whose inclination to the line of sight is 78.°8 (Davydov et al. 2008) and the position angle on the plane of the sky is 98.°2 (Stirling et al. 2002). At these distances the jets are ballistic (e.g. Fig. 2 of Roberts et al. 2010), with the possible exception of the predicted 10% deceleration and twist (the shift of the precession phase by ~−0.1) in the innermost ~0.′′5 (Panferov 2014; see also Stirling et al. 2004). At larger distances the jets become unobservable, possibly because of weakening of the interaction of the jet with the ambient medium. The jet there would look like a hollow cone of tightly wound coils, which are probably blending. The cone of the precession is indicated on the radio image (Dubner et al. 1998) of the eastern part of W 50 in Fig. 1; evidently, the cone fits the orientation and transverse size of the ear. The overlaid X-ray image2 in Fig. 1 suggests that the lobe of the X-ray emission, observed at distances >15′ from SS 433 (Watson et al. 1983; Brinkmann et al. 1996), shapes the jet. However, the angular extension of the lobe in the hard X-ray band, >1 keV, is much smaller than the opening 40° of the precession cone. Are the jets recollimated? On the contrary, the optical filaments at the contact between the ears and sphere of W 50 (Boumis et al. 2007, Figs. 1 and 2), which possibly trace the interaction of the jet and spherical shell of W 50, subtend an angle a little more than 40° at SS 433. The eastern lobe, which is more exposed in observations, has sharp edges in the hard X-ray band and is almost perfectly axisymmetrical and smooth, with the exception of the bright knot (Fig. 1; Brinkmann et al. 2007, Figs. 3 and 8). The latter is probably the segment of the nearly spherical shell that is heated by the jet (Watson et al. 1983).
For more than 30 yr the problem of the recollimation of the SS 433 jets has inspired investigation. Eichler (1983) has proposed that a precessing jet merges in a smooth hollow cone and inevitably undergoes focusing by the ambient pressure. Kochanek & Hawley (1990) have ascertained the problems staying before the hydrodynamical simulations of the Eichler mechanism and the pointed form of the W 50 ears for the case of a hollow conical jet. Later, from a series of hydrodynamical simulations targeted at the geometry of the ears, Goodall et al. (2011b) have devised a history of the jet evolution intermittent in the speed and precession cone opening. Moreover, they got the recollimation mechanism to work, although the mechanism is inefficient for the formation of the ears of the observed narrowness. However, the typical characteristics of intermittent jets are not seen; in W 50 the X-ray lobes are rather smooth at large scales.
In particular, Goodall et al. (2011b) find that the SS 433 jet should decelerate only at the terminal shock, i.e. in the ear. On the other hand, from the non-observation of the proper motion of the radio filaments in the ears, Goodall et al. (2011a) determined that the jet velocity in the ears is at least eight times smaller (for the distance D = 4.5 kpc) than the optical jet velocity vj0 = 0.2581c, where c is the speed of light (Davydov et al. 2008). Besides, the brightness of the X-ray ring-like structure at distances ~60′, thought to be a terminal shock, coincident with the radio filaments in the eastern ear, is much smaller than that of the X-ray lobe at 15–45′ from SS 433 (Brinkmann et al. 2007, Figs. 1 and 2). It is difficult to explain this unless the jets decelerate in the interior of W 50.
Thus, questions remain about the evolution of the jets of SS 433 at the scale of W 50 and their role in the inflation of W 50. This paper solves the key question: Could the jets decelerate in the interior of W 50 before termination in the ears? Firstly, in Sect. 2 we characterize the physical conditions of the propagation of the jets in the eastern X-ray lobe using the available X-ray observations, namely the density and pressure in the surroundings of the jet. On the basis of found pressure, we clarify the age of the nebula W 50 and the roles of a supernova remnant (SNR), SS 433 system wind, and the jets in the nebula formation in Sect. 3. Encouraged by the studies of the decelerating relativistic jets of the Fanaroff-Riley class I radio galaxies, in Sect. 4.1 we construct the model that would fit mass entrainment from the environment into the jets of the radio galaxy 3C 31, the well-known case of continuously decelerating jets. The entrainment model is applied to the SS 433 jet, and results on the jet behaviour at scales of dozens of parsecs are presented in Sect. 4.2. The conclusions are given in Sect. 5.
2. Physical conditions inside the radio nebula W 50
Deceleration of the SS 433 jets issues from the interaction of the jets with the ambient medium. Physical conditions of the jets propagation are little known. From Einstein Observatory observations, Watson et al. (1983) estimated temperature kT ~ 2 keV and average electron number density ne ~ 0.1 cm-3 (for the observer distance 5.5 kpc) between 15′ and 42′ from SS 433, in the X-ray lobe aligned with the eastern jet axis, and the density range ~0.16–0.7 cm-3 between the faintest, at r> 45′, and brightest, at r ~ 35′, regions. Their estimation of kT ≲ 0.17 keV for the W 50 shell from the non-detection implies an age of W 50 of ≳50 000 yr as determined from the Sedov solution for a SNR. From XMM-Newton observations (Brinkmann et al. 2007; the following parameters are only for the eastern X-ray lobe): in the bright knot at r ~ 35′ and in the sampled region closer to SS 433 the temperature is ≈0.22 keV, or ten times lower than the Watson et al. estimate, and the filamentary X-ray emission in the radio ear, supposedly of the jet terminal shock, has a temperature of ≈0.28 keV; besides, spectra of these regions are consistent roughly with the solar abundances, have a hard power law component, and the region of W 50 in the field of view of the observations shines faintly in the soft X-ray, <2 keV. Luminosity, ≳6–8 × 1034 erg/s for the power law plus thermal components, and number density, ne ~ 0.2–0.7 cm-3, were estimated for the bright knot alone. Unfortunately, the detail distribution of physical parameters over the lobe was not determined and those parameters that are found are not proper parameters of the jet surroundings, being extracted from the radiation projected over different regions of W 50.
The eastern X-ray lobe has the high contrast narrow conical core of hard emission, >1 keV, mainly of the power law nature (Brinkmann et al. 2007, Fig. 8). This core is more or less uniform, with a flat transverse profile, its opening is ~30°, although it subtends an angle of 18° at SS 433. The apex of the hard emission core falls slightly above the precession axis at a distance from SS 433, which is a little larger than 15′. This is seen also in Fig. 1, where the highest contrast image of the lobe, in the band 1.0–2.0 keV, is overlaid on a radio image of W 50. At the energies <1 keV, this core is not seen against a diffuse background (Brinkmann et al. 2007, Fig. 8), although a hint of the separation between the core and the surroundings could be in the two small troughs in the cut of the ROSAT image in the band <1 keV (Brinkmann et al. 1996, Fig. 8). These troughs are separated by 18° in azimuth and symmetric relative to the jets axis. Such an X-ray core is thought to map the hollow conical jet per se, which is recollimated and separates an interior spine from an exterior cocoon, and thus the hard emission of the lobe is localized to the jet and its neighbourhood. The hollow morphology of the jet is also supported by the ring-like X-ray structure in the ear (Brinkmann et al. 2007). The more wide spread soft emission of the lobe barely increases to the jet axis. We accept therefore that this soft emission has a thermal component, as argued by Brinkmann et al. (2007) for the different regions of the lobe. The indistinguishability of the spine at energies <1 keV means that temperatures of the cocoon and spine are nearly the same, and equal to the temperature ≈0.22 keV of the two regions of the Brinkmann et al. (2007) spectral analysis.
Now, we estimate the density of the thermal gas of W 50 in the jet surroundings. For this purpose, we make use of the normalization of the thermal component of the knot flux found by Brinkmann et al. (2007). These authors found an unabsorbed flux of F0 = 9.9 × 10⁻¹² erg/cm2 s in the energy band 0.2–2 keV at a distance of 5 kpc. We scale their F0 to the thermal flux of the core using the radial profile of the lobe brightness in the 0.5–4.5 keV energy band, which was obtained by Watson et al. (1983, Fig. 2) from the cut over the azimuth range 2θr = 16°, indicated in Fig. 1; we note that this cut does not exactly overlay the hard emission core. From this profile, a ratio of the absorbed count fluxes of the core, taken between the distances 15′ and 33′, and the knot, between 33′ and 42′, is  , where the indexes c and k mean the core and knot and the prime means an absorbed value. We note that f′ is the background subtracted count flux in the 0.5–4.5 keV energy band, integrated over an area of the cut. The hardness ratio f′( > 1.5 keV) /f′( < 1.5 keV), over the ROSAT energy range 0.1–2.4 keV, is nearly constant through the core and knot (Brinkmann et al. 1996, Fig. 9). Besides, the latter two are similar in a spectrum (Brinkmann et al. 2007). Hence, they are nearly equal in a ratio h ≡ fpl/fth of fluxes of the power law and thermal components, i.e. hc ≈ hk. Then a ratio of the unabsorbed count fluxes of the core and knot equals approximately one of the absorbed fluxes, i.e. fc/fk ≈ a. With substitution of the decomposition fc = fc th + fc pl = fc th(1 + hc), this equation reduces to the proportion
 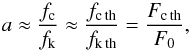 (1)where one accounts for the parity of the core and knot in h and temperature. The 0.2–2 keV energy flux Fc th, emitted by the chosen core region should also be translated into the total thermal flux. The translation coefficient of ≈3.1 was determined from the APEC model spectrum (V. Doroshenko, priv. comm.) of an optically thin coronal plasma of the solar abundances, and of temperature 0.22 keV. Upon these the corresponding total thermal luminosity of the core is Lc th ≈ 3.8 × 1034 erg/s
  , where D4.5 ≡ D/ 4.5 kpc.
The region of the clearly discerned soft emission is symmetrical about the jet axis and subtends an angle of 2θs ~ 60° at SS 433 (Watson et al. 1983, Fig. 3; Brinkmann et al. 2007, Fig. 8). A volume of the segment of this region, which contributes into the radial profile of Watson et al. (1983), between distances r1 = 15′ and r2 = 33′, can be approximated by the formula for a cone truncated on the top and by two azimuthal slices symmetric relative to the cone axis, neglecting the inclination of the jet axis to the plane of the sky, as follows: 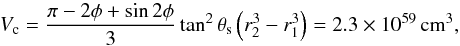 (2)where φ = arccos(tanθr/tanθs). We estimate homogeneous number density of the jet surroundings in the eastern X-ray lobe as
 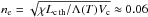 cm
cm . Here, the equilibrium cooling rate Λ = 10-22.32 erg cm3/s from (Sutherland & Dopita 1993) and the electron to ion number density ratio χ ≡ ne/ni = 1.1 for the solar abundances are accepted. For a consistency check, our estimation of the knot density is ne ≈ 0.56 cm-3 versus the Brinkmann et al. (2007) 0.2−0.7 cm-3. Fortuitously, nearly the same estimation have been given by Watson et al. (1983) for the lobe in whole, ne ~ 0.1 cm-3 for the distance 5.5 kpc, although they used a temperature that is ten times higher. The ready density estimation
  only gives an upper limit of the average density in a heterogeneous medium, which is a case anticipated in the jet vicinity. Here, we used the miniscule information contained in the X-ray observational data. In principle, an exceptional geometry of the X-ray lobe, that is the axisymmetric lobe with the axis lying close to the plane of the sky, allows us to restore the tridimensional axisymmetric distribution of the lobe emissivity and, therefore, of the gas density.
The temperature and density of the X-ray lobe bound tightly those of the W 50 interior, which we consider here only beyond the first ~15′ from the centre. W 50 is rather of the same density as the lobe, ne ~ 0.1 cm-3: the jet ejected mass is nothing but  M⊙ over the tentative lifetime of tj = 104 yr. And, W 50 would have a temperature of ~0.1 keV, because the nebula is yet observed in whole in the soft X-ray emission (Brinkmann et al. 2007). It can also be seen on the particular cut of W 50, shown by Brinkmann et al. (1996, Fig. 8), that in the energy band <1 keV that is dominated by the thermal emission, the X-ray lobe is hardly discernible against W 50, while the latter is noticeable against the background. Then pressure within W 50 is PW50 = (1 + 1 /χ)nekT ~ 3 × 10-11 erg/cm3. The increase of pressure by only several times makes W 50 as bright as the X-ray lobes. Surprisingly, this is nearly the pressure claimed by Eichler (1983) for the recollimation of the SS 433 jets. We note that a non-thermal pressure in W 50 of 0.56 × 10⁻¹¹ erg/cm3 is significantly smaller than PW50, by our estimation from the data of Dubner et al. (1998) on the synchrotron radio emission of the spherical component; the thermal pressure found in the X-ray lobe is inconsistent with the gas density ~0.01–1 cm-3 in the eastern optical filaments, reported by Abolmasov et al. (2010).
3. Origin of the radio nebula W 50
Given the W 50 inner pressure PW50, we could elucidate the age of W 50, its origin, and the role of the SS 433 jets in the nebula evolution. The spherical component of the nebula W 50 could be inflated by a supernova or a powerful wind. In both cases, while the bubble has passed the first short stage of free expansion into the interstellar medium, the radius of its forward shock develops for long as  (3)where ξ = 1.15 and 0.88 for the SNR and wind, respectively; ρ0 is the density of the interstellar medium, which is assumed henceforth to be homogeneous, b = 2/5; E0 is the initial energy of the SNR; and E0 = Lwt in the case of the wind with kinetic luminosity Lw (see Weaver et al. 1977, on a wind bubble; and e.g. Kim & Ostriker 2015, on a SNR). This is the so-called adiabatic phase or the Sedov phase in the case of a SNR. Further, after the formation of a dense, thin, and cold shell behind the forward shock, as a result of radiative cooling of the swept-up and compressed interstellar gas, the bubble expansion changes: in the case of a wind bubble, only in constant ξ, 0.76, and a SNR obeys a new law, R ∝ t2/7, as is prescribed by the snowplough model of the shell, driven by pressure of the hot interior of the bubble through the interstellar medium.
W 50 has likely passed the adiabatic phase, as is evidenced by a faint optical emission on the periphery of W 50 (Boumis et al. 2007). The interior of this mature bubble is suggested to be almost isobaric and to have nearly flat profiles of temperature and density due to thermal conduction (Weaver et al. 1977; Cui & Cox 1992), not to mention the possible turbulent mixing driven by the jets. Moreover, in any scenario of the W 50 origin, the powerful hypersonic wind from the super-Eddington accretion disc in SS 433 system, of mass flow rate  M⊙/yr (Fuchs et al. 2006; see also Perez & Blundell 2009), would only extend to an inner shock in the bubble interior; before this inner shock the gas is cool, ~2 × 10⁴ K, and tenuous, nw ∝ r-2, and beyond the shock the gas becomes hot and dense (Weaver et al. 1977). The shock radius would be of the order of
  pc, or ~10′, as determined from continuity of momentum flux at the shock jump, where vw = 1500 km s-1 is the wind maximal velocity (e.g. Perez & Blundell 2009). However, we should not rely on the isotropy assumed in this estimation. Such inner structure of W 50 conforms with the nearly flat appearance of the X-ray lobe and with the ignition of the X-ray lobe at the radius ~15′, which is supposedly the wind inner shock radius (Königl 1983).
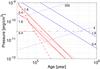 |
Fig. 2 Contour map of the parameters of interstellar bubbles on the plane (age, pressure). The red solid and long dashed lines on the left indicate SNRs. The blue short dashed lines indicate wind blown bubbles. The red long dashed line indicates the line of the shell formation in SNRs: the Sedov phase (adiabatic) lies on the left of this line. The thick lines indicate the interstellar hydrogen density contours in units of cm-3. The thin lines indicate the SNR initial energy contours in units of 1051 erg, and the wind power contours in units of 1037 erg/s. The line of circles indicate the observed pressure of the W 50 nebula. |
A mean pressure of a bubble is determined as P = (Γ−1)Eth/V, where Γ = 5/3 is the adiabatic index for thermal plasma, Eth the thermal energy of the bubble interior of volume V = 4πR3/ 3. In the Sedov phase (the adiabatic phase), this energy is constant, Eth = E0 th ≡ 0.717E0, and in the snowplough phase the SNR energy decreases because of adiabatic and radiative losses as Eth = 0.8E0 th(rsf/R)2(tsf/t), which is the function fitted by Kim & Ostriker (2015) to their numerical simulations. Here  (4)are the time and radius at the shell formation epoch, E51 ≡ E0/ 1051 erg, n0 ≡ nH/ 1 cm-3, and nH the interstellar hydrogen density. In the case of a wind bubble, Eth = (5/11)E0, in both the adiabatic and idealized snowplough phases, without accounting for the radiative cooling of the hot interior gas, which can be significant at large times, i.e. >100 000 yr in the particular case of Lw ~ 1036 erg/s (Weaver et al. 1977). Using the above formulated laws R(t) and Eth(R,t), we plotted the contours of E0, ρ0 and Lw on the plane (t,P) in Fig. 2, where P is the mean pressure inside a spherical bubble of the radius 38 pc of the spherical component of W 50 (at the distance 4.5 kpc). The interstellar density contours for both models are nH = 0.4 and 1.6 cm-3, which overlaps with the initial density range of the HI gas in the neighbourhood of W 50 found by Lockman et al. (2007) and scaled to the distance 4.5 kpc. The SNR energy contours E0 = 0.4 and 1.6 times 1051 erg just overlap the typical energy 1051 erg of SNRs. The wind power contours Lw = 4 × 1037 and 2 × 1039 erg/s demarcate a region between the kinetic luminosities of the supercritical accretion disk wind and the hypothetical wind of the jets as if they energize W 50 isotropically.
In view of the observed pressure PW50 ~ 3 × 10-11 erg/cm3, the line of shell formation in Fig. 2, determined by Eqs. (4), restricts the age of W 50 as a SNR by tW50 ≥ 97 000 yr, and an intersection of the admitted nH and E0 ranges corresponds to the ages just over 100 000 yr; cf. the most probable lifetimes 10 000−100 000 yr of SS 433 as a binary system undergoing a super-Eddington accretion estimated by King et al. (2000). Further, the disk wind scenario matches well the observed pressure, but at the cost of the uncomfortable large ages ~300 000–700 000 yr. However, the unaccounted radiative cooling of the hot interior gas of a wind bubble would shift the bottom parts of the wind contours to the small ages in the same manner as it bends the SNR contours while they pass the shell formation line. With respect to the jets as a source of the wind, without a pre-existing SNR, they would overwhelm W 50 in the energy in ~10 times during a lifetime of >100 000 yr. So, the wind scenarios with the admitted nH range issues in either the improbable large age or exaggerated pressure. This is because a continuous injection of energy is a less effective way to blow a bubble than an initial blast, as is seen from the difference between both models in the constant ξ in Eq. (3). The exaggeration of pressure seems to be proper to the mix scenario as well, when the jets are fully slowed down in the interior of a pre-existing bubble. In reality, the decelerated jets would distort the sphericity of the bubble. All this suggests that the radio nebula W 50 was initiated by a supernova explosion well near 100 000 yr ago, and the SS 433 jets propagate in the pre-existing SNR and have to deposit most of their huge kinetic energy beyond the SNR radius, unless their lifetime is short enough, i.e.  (5)where ζ is the ratio of the jets energy transferred to the SNR to the total energy of the jets. This SNR would have an initial energy in the range 1.0–3.7 × 1051 erg, bounded by the interstellar density range nH = 0.4–1.6 cm-3.
The above picture of the origin of W 50 is built on the assumption that the interstellar medium is homogeneous. In the case of the inhomogeneity, the bubble expands faster, therefore its age for a given radius is smaller, which depends on the volume filling (e.g. Korolev et al. 2015, Fig. 4). At that, the relative roles of the SNR, disk wind, and jets in the origin of W 50, discussed above, are thought not to change. We note that just the inhomogeneity allows such a small age as ~100 000 yr in the wind blown bubble model devised by Königl (1983).
4. Deceleration of the SS 433 jets in the X-ray lobes
It is a challenging problem to link the jets of SS 433 observed downstream of the source to only ~6′′ with the jet signatures at parsec scales. In the innermost regions of W 50, the jet travels through the low density cavity, evacuated by the hypersonic wind from SS 433. Just before the wind shock, at the suggested radius r1 ~ 15′, the isotropic wind hydrogen density  cm-3 is much smaller than the observed density of the X-ray lobe, where mH is the mass of hydrogen. Going through this shock into significantly denser medium that is some hundred times denser, the jet becomes strongly underpressured and possibly realigns to the state of pressure equilibrium with the surroundings. Separate strong shock waves are not seen, but there is an abrupt appearance of an X-ray lobe. The conspicuous conical core of the lobe, of half-angle θc ~ 15°, suggests that the jet is recollimated to the core opening. Moreover, the jet should be hollow. If all mass within the cone of mass density
  , where ne ~ 0.1 cm-3 and
  , were incorporated into the jet, the latter would be as slow as
 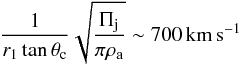 (6)at the beginning of the X-ray lobe because of conservation of the jet momentum flux Πj, that is ~a hundredth of the initial velocity; this means almost full dissipation of the jet kinetic energy. This does not stand out in brightness and, therefore, is improbable; besides, the jet should yet thrust the ear and provide the ring-like morphology of the terminal shock at distances r ~ 60′ (Brinkmann et al. 2007). Hereafter, we accept this geometry of the jet, with the tentative half-angle θj ~ 4° of the filled surface layer of the hollow conical jet, which could be provided by the jet nutation at the origin (Borisov & Fabrika 1987), and can be substantiated by width of the brightness depression at the boundary of the hard X-ray core observed in the soft X-ray cut, which was discussed in Sect. 2.
The fact of observation of the more or less smooth X-ray lobe suggests continuous deceleration of the jet of SS 433. In general, a jet spends momentum via viscous stresses at the interface with the ambient medium. The viscosity probably is dominated by turbulence and magnetic fields. Indeed, the boundary between two shearing flows is inevitably unstable, which gives rise to turbulent mixing of the fluid in the boundary layer (Landau & Lifshitz 1987, Sect. 29, 36). Thereafter, this layer ingests mass from both flows: between vortex-free and vortex layers fluid only flows from the first to the second (Landau & Lifshitz 1987, Sect. 35). As a result, in the case of a jet, the latter entrains the ambient medium. This picture is supported by the observed evolution of a transverse velocity profile of the gradually decelerating jets of Fanaroff-Riley class I (FR I) radio galaxies, and by a conservation law analysis of these jets (see Laing & Bridle 2014, for a comprehensive study of the kinematics and dynamics of FR I jets). However, deceleration of relativistic jets is not predictable by existing models. The jets of SS 433, similar to FR I jets, do not have a prominent hot spot at the end, contrary to FR class II jets, which are essentially relativistic until the hot spot.
4.1. Mechanism of mass entrainment in relativistic jets
For the jets of the FR I radio galaxy 3C 31, Laing & Bridle (2002) derived the semi-empirical function of the rate of mass injection into the jet (or, rather, the entrainment rate) in the dependence on the jet distance r from the galaxy nucleus on the basis of the laws of conservation of mass, energy, and momentum. Further, Wang et al. (2009) derived the entrainment rate for the case of equilibrium in the pressure of these jets with their surroundings. Figure 3 shows the longitudinal profile of mass flux  of the entrained surrounding matter per unit area of the jet surface, henceforth the external entrainment, for the 3C 31 jets, obtained from the Wang et al. (2009) boundary-layer entrainment g and internal entrainment gs, which could be from the supposed jet-contained stars, as follows:
 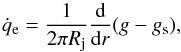 (7)where Rj is the jet radius, given by the jet geometry from Wang et al. (2009). However, it is not clear how correct the external entrainment is when defined in this way, just subtracting the internal entrainment because Wang et al. (2009) did not account for the internal entrainment in their model of the boundary-layer entrainment, while the latter is the total entrainment required by jet kinematics. The internal entrainment rate normalized to unit area of the jet surface is also shown in Fig. 3. As Wang et al. (2009) have noted, uncertainties of the internal entrainment defined by their Eq. (37) are large.
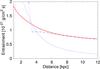 |
Fig. 3 Entrainment along 3C 31 jets: the flux densities of the external entrainment (blue dash-dotted line with circles) and of the internal entrainment (blue dashed line) after Wang et al. (2009), and the theoretical external entrainment of the form (9) (red solid line). |
Looking for a formalism of the entrainment, which would hopefully fit any relativistic jet, we confronted the profile  in Fig. 3 with a simplistic model. In a frame comoving with the mean local flow in the medium adjacent to a jet, the velocity of turbulent irregular pulsations in this flow is vt, and the velocity of the jet vj. The pulsating component of a movement we restrict for the sake of simplification only to six reciprocally orthogonal directions, for example along the Cartesian coordinate axes, with X axis aligned with the vector vj, so that in the comoving frame at any point of the average jet boundary, turbulent fluid moves into the jet only one-sixth of the time. Hence, the density of mass flux into the jet is ρavt/ 6, where ρa is the mass density of the ambient medium. A part of the mass flux is swallowed by the jet and the remainder continues the turbulent dancing with the adjacent flow. Namely, we impose that the jet only absorbs the component of momentum p of the turbulence pulse in the jet rest frame, which is perpendicular to the jet boundary, i.e. a proportion of the absorbed part of the momentum is
 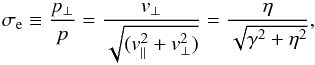 (8)under constancy of mass density of the turbulent fluid, where v⊥ = vt/γ is the perpendicular component of the velocity of the turbulence pulse in the jet rest frame, v∥ = vj the parallel component, η = vt/vj, and γ = (1−(vj/c)2)− 1/2 is the Lorentz factor. The parameter σe is in essence the cross-section of the entrainment process. We note that σe = sini, where i is the inclination of the velocity of the turbulence pulse to the jet boundary in the jet rest frame. Then, the flux density of the entrainment is
 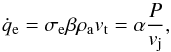 (9)where β = 1/6,
  the external pressure, cs the sound speed in the external medium,
 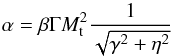 (10)the dimensionless viscosity parameter, and Mt = vt/cs the Mach number of the turbulence. The matter entrained from the surroundings is mixing with the jet matter, and accelerating to the jet velocity vj, which should be provided by the flux of the jet momentum
 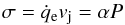 (11)per unit area of the jet surface that is transferred normally to the jet boundary; that is the viscous stress due to turbulence, or Reynolds stress. It appears that the viscous stress (11) at the jet boundary has the functional form just as is in the Shakura & Sunyaev (1973) α-model for accretion disks, and as has been derived by Begelman (1982) for extragalactic jets to explain their heating via viscous stresses.
To plot the entrainment function (9), we used the profiles of pressure P(r), density ρa(r), and velocity vj(r) from (Wang et al. 2009). A Mach number of the turbulence of Mt = 1 was accepted as the best guess for supersonic jets. In Fig. 3, this function fits the overall data on the 3C 31 jet, the magnitude and slope of the external entrainment profile, and does it excellently for the jet region beyond ~6 kpc, if 1/5 is used instead of the coefficient β = 1/6 in Eq. (9). This 20% difference between the prescription by our simplistic model and the observations could be explained in a more rigorous theory. The worse match before ~6 kpc can be explained partly by a difference between the flaring region at 1.1–3.5 kpc, where the jet realigns (Wang et al. 2009), and the more quiescent outer jet, and, on the other hand, by the increase of the internal entrainment upstream of the jet (Fig. 3), which is crudely estimated and subtracted to get the external entrainment. Such a successful fit encourages us to accept the model and apply it to the SS 433 jets under the coefficient β = 1/5.
4.2. Entrainment model of deceleration of the SS 433 jets
We can derive how much the velocity of the SS 433 jet changes with the distance due to the injection of matter from the ambient medium straightforwardly from the relationship v ∝ Π /Ṁ between momentum flux Π, which is constant, and mass flux Ṁ. The derivation is as follows. For the jet flow of the rest-frame mass density ρj and enthalpy ω = ρjc2 + ϵ + P, where ϵ is the internal energy density, and P is the pressure, with velocity vector vj and Lorentz factor γ, the flux density of mass and the flux density of the x-component of momentum through the surface piece, for which the outward unit normal vector is n, are, respectively,
 where index x means the component of a vector along the jet axis. The right part of Eq. (13) is derived neglecting the terms ϵ and P in the enthalpy ω of the mild relativistic jets of SS 433.
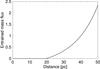 |
Fig. 4 Mass flux along the SS 443 jet provided by the entrainment, Ṁe, in units of initial mass flux, Ṁj0. |
Let the closed surface of an integration of the flux densities consist of the two cuts of the jet by the spheres of radii r0 and r, centred at the jet source, and the jet boundary surfaces between them, so that the velocity vector vj is normal to the cuts and tangential to the boundary surface. The jet density and velocity are supposedly functions of only the distance r, i.e. they have flat profiles over the spherical cuts, which could be provided by turbulent mixing. Then, for the hollow conical jet. the mass fluxes in absolute value are  (14)through the jet cut of an area S, and
  (15)through the jet surfaces between the cuts, where the integration is over the jet distance from the source, ζ is the variable of the integration, 2πζsin(θc−θj)dζ, and 2πζsin(θc + θj)dζ the squares of the ring segments of width dζ of the inner and outer surfaces of the hollow jet at the distance ζ, respectively. Here the entrainment flux density is assumed to be the same on the both sides of the hollow jet. Over the chosen above closed surface, the integrations of the densities (9, 12) for the flux of mass and (13) for the flux of momentum give zeros, i.e.
 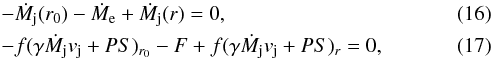 in the case of the jet in a steady state, one more idealization of the model. Here, the first and third parts in both equations are the fluxes through the spherical cuts at radii r0 and r, respectively, f the modulus | nx | averaged over a cut, and the momentum injected through the jet boundary surface by the entrained matter is neglected because it is miniscule. The buoyancy term
 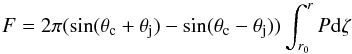 (18)summed with other members of Eq. (17), containing pressure P, results in zero in the case of pressure equilibrium of the SS 433 jet with the ambient medium, assumed to be isobaric. Then, Eq. (17) is reduced to the anticipated ratio of the jet velocities at radii r and r0
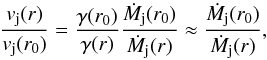 (19)where the approximation by the right part has a maximal error of 3.6%. Eqs. (19), (16), (15), (9) have a solution
 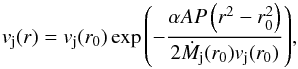 (20)under the conditions η ≪ γ = 1, and constancy of the viscosity parameter α and the pressure P, where A = 2π(sin(θc−θj) + sin(θc + θj)).
The profile along the jet of the mass flux Ṁe in Fig. 4, which follows from the system of Eqs. (19), (16), (15), (9), shows a rate of the loading of mass from the surroundings into the SS 433 jet as much as the initial jet mass flux,  . We used the parameters β = 1/5 and Mt = 1, the jet geometry with θj = 4° and θc = 15°, and the uniform physical conditions P = 3 × 10-11 erg/cm3 and ne = 0.1 cm-3 in the region r > 20 pc (Sect. 2). This loading issues in a relative decrement of the jet speed of δvj ≡ 1−vj/vj(r0) = κ/ (1 + κ) ≈ 63% at the distance of the X-ray bright knot ~35′ (~46 pc), i.e. yet before the entry into the ear, where κ = Ṁe/Ṁj(r0), and the radius r0 refers to the parameters at the jet beginning. The jet kinetic luminosity is decreasing by the same part, 1−Lk/Lk(r0) = δvj. The mass loading in the wind cavity region, at r < 20 pc, is insignificant, because of low pressure. In contrast, the density and pressure in the region of the shell, marked by the X-ray bright knot, should only rise and the mass loading should rise as well.
5. Concluding remarks
The morphology of the eastern X-ray lobe in W 50 provides evidence for a continuous proceeding of the SS 433 jet through the nebula on scales of dozens of parsecs. At that, the jet is found to be recollimated from the opening 40° to the ~30°. The X-ray brightness distributions in the soft and hard energy bands of the XMM-Newton observations are consistent with the hollow structure of the jet. This picture suggests that the jet bypasses the bright knot at r ~ 35′, which resides at the place of the shell that existed even before the jet.
From the X-ray observations presented in (Watson et al. 1983, Brinkmann et al. 1996, 2007), we derived an electron density of ~0.1 cm-3 and a pressure of ~3 × 10-11 erg/cm3 for the thermal gas in the spherical component of W 50. We note that only the XMM-Newton observations have allowed Brinkmann et al. (2007) to extract securely the thermal components from the X-ray emission of the bright knot and, less securely, from the region to the west of the knot. However, they have not characterized the physical conditions in the X-ray lobe in whole. Solely a model of SNR dynamics predicts the observed pressure in conjunction with the reliable ages of SS 433 10 000–100 000 yr (King et al. 2000), not a model of stellar wind bubble. Although this is not conclusive in the case of an inhomogeneous ambient medium, when the wind origin of W 50 is possible too (Königl 1983). Such small observed pressure pinpoints W 50 as an old SNR of age ~100 000 yr, which is obtained by accounting for radiative losses of the SNR in the pressure driven phase, unlike all previous estimations of the age of W 50 based on the Sedov model. In the case of an inhomogeneous interstellar medium, the age would be smaller. An influence of the jets on the spherical component would be restricted to prevent a large distortion of the sphericity, therefore the jets exhaust most of their energy into the ears or are much younger than the SNR. The thermal energy content in the W 50 nebula is ~(Γ−1)PW50(VSNR + VE + VW) = 4.4 × 1050 erg, where VSNR = 6.6 × 1060 cm3, VE = 2.4 × 1060 cm3, and VW = 6.9 × 1059 cm3 are the volumes of the spherical component, the eastern and western ears, respectively. Supposedly, the same amount of energy is contained in the kinetic energy of the shell of the nebula, then the total energy of W 50 is ~1051 erg.
The simulations of Goodall et al. (2011b) provide an important view that the jet-SNR interaction does not influence the expansion of the spherical shell of W 50, and the jets are a relatively young phenomenon, ≲20 000 yr, which is the age they give to the nebula W 50. The latter stems naturally from an amount of the jets momentum imparted to the ears, and hence from the size of the ears. Besides a clarification of the role of the jets in the origin of W 50, this justifies the application of theories of the spherical wind bubbles and SNRs to the evolution of W 50. However, such a small age of the spherical component of W 50, obtained in the simulations, not only contradicts our result based on a theory of the shock dynamics of SNRs, but also the simulations on SNRs elsewhere (e.g. Kim & Ostriker 2015; Korolev et al. 2015).
The Goodall et al. (2011b) simulations invoke the intermittent activity of the jets for the observed shape of the ears. As such, the continuous activity, coupled with recollimation and deceleration, applies more directly to the observed non-unique properties of the jets of radio galaxies of Fanaroff-Riley Class I (Laing & Bridle 2014). There seems to be a similarity between these jets and the SS 433 jets: the pressure jump in the surroundings, which is afforded possibly by the wind in the case of W 50, beyond which the jets brighten, recollimate, and decelerate (the latter two are obvious only for FR I jets), and the faintness of terminal shock at the jet head, contrary to the prominent hotspots of FR II jets, which is the characteristic of decelerated jets.
Indeed, the derived pressure of W 50’s interior turns out to be so large as to cause deceleration of the jet via the viscous jet-surroundings interaction. There is as yet no theory of this interaction for relativistic astrophysical jets. The studies of FR I jets suggest that these jets decelerate continuously via entrainment of the ambient medium. We devised the model of the entrainment that successfully fits the semi-empirical profile of entrainment rate for the jets of the radio galaxy 3C 31 found by Wang et al. (2009). By this model, the entrainment results from turbulence at the jet surface, which exerts in effect a viscous tension in the jet σ = αP, of the well-known form in the theory of accretion disks, where the viscosity parameter α is defined by the model. This model predicts that the eastern jet of SS 433 decelerates by ~60% in bounds of the circular shell of W 50.
Thus, the decelerated jet would inject ~half of its energy into the spherical component of W 50. For the sphericity, the age of the jets, Eq. (5), should be much smaller than 27 000 yr, which is consistent with the age delimitation in Goodall et al. (2011b). Also, there seems to be a balance between the jet power and luminosity of the X-ray lobe. During tentative lifetime, tj ~ 104 yr, the jet put approximately half the ejected energy Wj = Lj0tj ~ 3 × 1050 erg in the expansion of W 50; another part was deposited into the thermal energy of the interior gas. An estimation Wth = Lthtth ~ 3 × 1049 erg, where Lth ~ 1035 erg/s is the thermal luminosity of the X-ray lobe (Sect. 2) and tth ~ kT/neΛ ~ 107 yr is the time of the radiative cooling of the lobe, gives for the thermal energy ~1/10 of the Wj versus the above proportion ~1/2. The discrepancy by a factor of 5 is possibly attributable to roughness of our estimations.
Further studies of the distribution of physical parameters in the nebula W 50, in particular on the basis of the available X-ray data, would improve the above picture of the evolution of the SS 433 jets on scales of dozens of parsecs.
1′′ = 0.67 × 1017 cm at the observer distance of D = 4.5 kpc, accepted hereinafter (Stirling et al. 2002; Panferov 2010; Marshall et al. 2013; see also Lockman et al. 2007, and Panferov 2014, for discussion on the distance); data from the literature are compiled to this distance.
The HEASARC data archive, http://heasarc.gsfc.nasa.gov/FTP/xmm/data/rev0//0075140401/PPS/, the EPIC PN camera of the XMM-Newton observatory.
Acknowledgments
We would like to thank Victor Doroshenko, Vladislav Stolyarov, and Valery Suleimanov for invaluable help in the work on the paper. We are also grateful to the referee for valuable comments.
References
- Abell, G. O., & Margon, B. 1979, Nature, 279, 701 [NASA ADS] [CrossRef] [Google Scholar]
- Abolmasov, P., Maryeva, O., & Burenkov, A. N. 2010, Astron. Nachr., 331, 412 [NASA ADS] [CrossRef] [Google Scholar]
- Begelman, M. C. 1982, IAU Symp., 97, 223 [NASA ADS] [Google Scholar]
- Bordas, P., Yang, R., Kafexhiu, E., & Aharonian, F. 2015, ApJ, 807, L8 [NASA ADS] [CrossRef] [Google Scholar]
- Borisov, N. V., & Fabrika, S. N. 1987, SvA Lett., 13, 487 [Google Scholar]
- Brinkmann, W., Aschenbach, B., & Kawai, N. 1996, A&A, 312, 306 [NASA ADS] [Google Scholar]
- Brinkmann, W., Pratt, G. W., Rohr, S., Kawai, N., & Burwitz, V. 2007, A&A, 463, 611 [NASA ADS] [CrossRef] [EDP Sciences] [Google Scholar]
- Boumis, P., Meaburn, J., Alikakos, J., et al. 2007, MNRAS, 381, 308 [NASA ADS] [CrossRef] [Google Scholar]
- Cui, W., & Cox, D. P. 1992, ApJ, 401, 206 [NASA ADS] [CrossRef] [Google Scholar]
- Davydov, V. V., Esipov, V. F., & Cherepashchuk, A. M. 2008, Astron. Rep., 52, 487 [NASA ADS] [CrossRef] [Google Scholar]
- Dubner, G. M., Holdaway, M., Goss, W. M., & Mirabel, I. F. 1998, ApJ, 116, 1842 [Google Scholar]
- Eichler, D. 1983, ApJ, 272, 48 [NASA ADS] [CrossRef] [Google Scholar]
- Farnes, J. S., Gaensler, B. M., Purcell, C., et al. 2016, MNRAS, submitted [arXiv:1604.06552] [Google Scholar]
- Fuchs, Y., Koch Miramond, L., & Abraham, P. 2006, A&A, 445, 1041 [NASA ADS] [CrossRef] [EDP Sciences] [Google Scholar]
- Goodall, P. T., Blundell, K. M., & Bell, B. S. J. 2011a, MNRAS, 414, 2828 [NASA ADS] [CrossRef] [Google Scholar]
- Goodall, P. T., Alouani-Bibi, F., & Blundell, K. M. 2011b, MNRAS, 414, 2838 [NASA ADS] [CrossRef] [Google Scholar]
- Kim, C.-G., & Ostriker, E. C. 2015, ApJ, 802, 99 [NASA ADS] [CrossRef] [Google Scholar]
- King, A. R., Taam, R. E., & Begelman, M. C. 2000, ApJ, 530, L25 [NASA ADS] [CrossRef] [Google Scholar]
- Kochanek, C. S., & Hawley, J. F. 1990, ApJ, 350, 561 [NASA ADS] [CrossRef] [Google Scholar]
- Königl, A. 1983, MNRAS, 205, 471 [NASA ADS] [CrossRef] [Google Scholar]
- Korolev, V. V., Vasiliev, E. O., Kovalenko, I. G., & Shchekinov, Yu. A. 2015, Astron. Rep., 59, 690 [NASA ADS] [CrossRef] [Google Scholar]
- Laing, R. A., & Bridle, A. H. 2002, MNRAS, 336, 1161 [NASA ADS] [CrossRef] [Google Scholar]
- Laing, R. A., & Bridle, A. H. 2014, MNRAS, 437, 3405 [NASA ADS] [CrossRef] [Google Scholar]
- Landau, L. D., & Lifshitz, E. M. 1987, Fluid Mechanics (Butterworth-Heinemann) [Google Scholar]
- Lockman, F. J., Blundell, K. M., & Goss, W. M. 2007, MNRAS, 381, 881 [NASA ADS] [CrossRef] [Google Scholar]
- Marshall, H. L., Canizares, C. R., Hillwig, T., et al. 2013, ApJ, 775, 75 [NASA ADS] [CrossRef] [Google Scholar]
- Panferov, A. A. 2010, Arxiv e-prints [arXiv:1001.5097] [Google Scholar]
- Panferov, A. A. 2014, A&A, 562, A130 [NASA ADS] [CrossRef] [EDP Sciences] [Google Scholar]
- Perez, M. S., & Blundell, K. M. 2009, MNRAS, 397, 849 [NASA ADS] [CrossRef] [Google Scholar]
- Roberts, D. H., Wardle, J. F. C., Bell, M. R., et al. 2010, ApJ, 719, 1918 [NASA ADS] [CrossRef] [Google Scholar]
- Shakura, N. I., & Sunyaev, R. A. 1973, A&A, 24, 337 [NASA ADS] [Google Scholar]
- Stirling, A. M., Jowett, F. H., Spencer, R. E., Paragi, Z., & Ogley, R. N. 2002, MNRAS, 337, 657 [NASA ADS] [CrossRef] [Google Scholar]
- Stirling, A. M., Spencer, R. E., Cawthorne, T. V., & Paragi, Z. 2004, MNRAS, 354, 1239 [NASA ADS] [CrossRef] [Google Scholar]
- Sutherland, R. S., & Dopita, M. A. 1993, ApJS, 88, 253 [NASA ADS] [CrossRef] [Google Scholar]
- Wang, Y., Kaiser, C. R., Laing, R., et al. 2009, MNRAS, 397, 1113 [NASA ADS] [CrossRef] [Google Scholar]
- Watson, M. G., Willingale, R., Grindlay, J. E., & Seward, F. D. 1983, ApJ, 273, 688 [NASA ADS] [CrossRef] [Google Scholar]
- Weaver, R., McCray, R., Castor, J., Shapiro, P., & Moore, R. 1977, ApJ, 218, 377 [NASA ADS] [CrossRef] [Google Scholar]
All Figures
|
Fig. 1 Image in 1–2 keV of the bright knot region (the XMM-Newton observatory), laid over W 50 radio image (Dubner et al. 1998), depicts the geometry of the eastern X-ray lobe in hard emission. The images are given at the epoch J2000, north is up, east is left, and SS 433 (RA = 19h11m49.s57, Dec = 04°58′57.′′9) is on the right. The spherical component of W 50, precession cone and its axis, ticked every 15′ from the beginning at SS 433 are indicated. The borders of the Watson et al. (1983) cut, for the radial profile of brightness, are delineated by arrows. |
| In the text | |
|
Fig. 2 Contour map of the parameters of interstellar bubbles on the plane (age, pressure). The red solid and long dashed lines on the left indicate SNRs. The blue short dashed lines indicate wind blown bubbles. The red long dashed line indicates the line of the shell formation in SNRs: the Sedov phase (adiabatic) lies on the left of this line. The thick lines indicate the interstellar hydrogen density contours in units of cm-3. The thin lines indicate the SNR initial energy contours in units of 1051 erg, and the wind power contours in units of 1037 erg/s. The line of circles indicate the observed pressure of the W 50 nebula. |
| In the text | |
|
Fig. 3 Entrainment along 3C 31 jets: the flux densities of the external entrainment (blue dash-dotted line with circles) and of the internal entrainment (blue dashed line) after Wang et al. (2009), and the theoretical external entrainment of the form (9) (red solid line). |
| In the text | |
|
Fig. 4 Mass flux along the SS 443 jet provided by the entrainment, Ṁe, in units of initial mass flux, Ṁj0. |
| In the text | |
Current usage metrics show cumulative count of Article Views (full-text article views including HTML views, PDF and ePub downloads, according to the available data) and Abstracts Views on Vision4Press platform.
Data correspond to usage on the plateform after 2015. The current usage metrics is available 48-96 hours after online publication and is updated daily on week days.
Initial download of the metrics may take a while.