Fig. 2
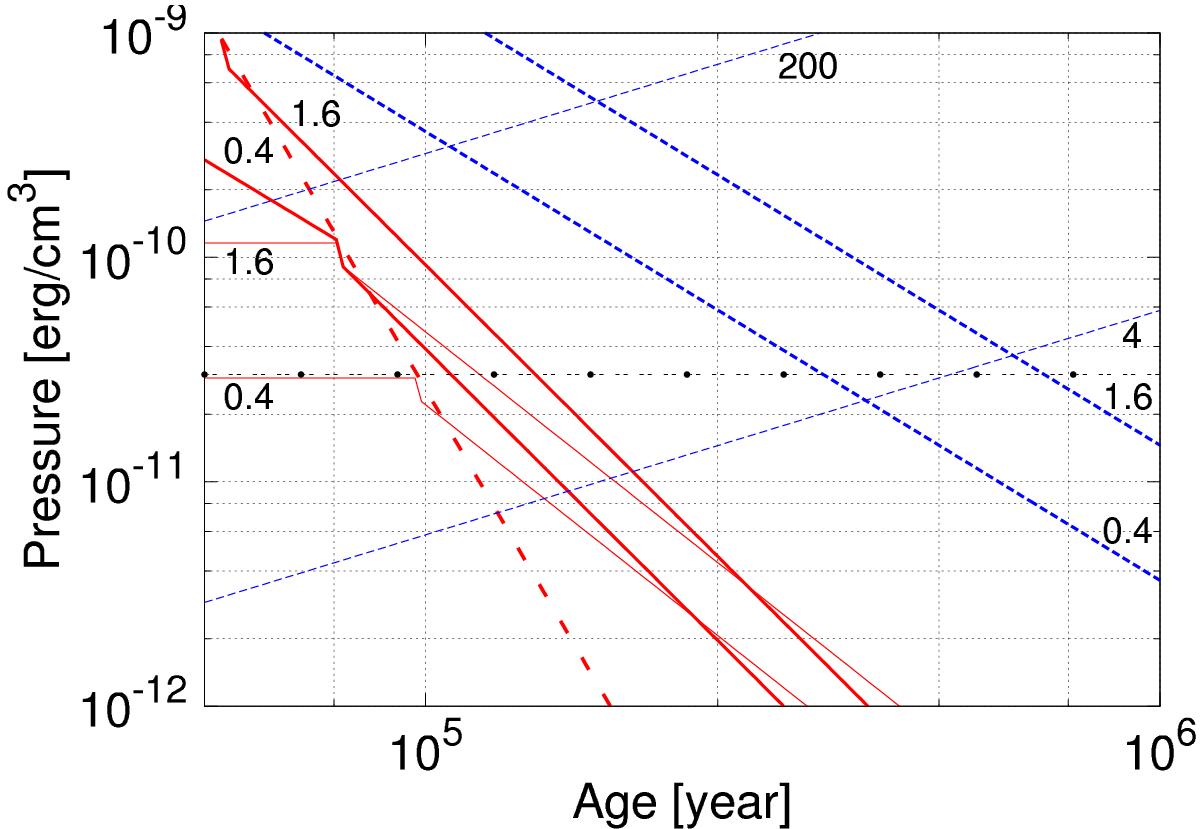
Contour map of the parameters of interstellar bubbles on the plane (age, pressure). The red solid and long dashed lines on the left indicate SNRs. The blue short dashed lines indicate wind blown bubbles. The red long dashed line indicates the line of the shell formation in SNRs: the Sedov phase (adiabatic) lies on the left of this line. The thick lines indicate the interstellar hydrogen density contours in units of cm-3. The thin lines indicate the SNR initial energy contours in units of 1051 erg, and the wind power contours in units of 1037 erg/s. The line of circles indicate the observed pressure of the W 50 nebula.
Current usage metrics show cumulative count of Article Views (full-text article views including HTML views, PDF and ePub downloads, according to the available data) and Abstracts Views on Vision4Press platform.
Data correspond to usage on the plateform after 2015. The current usage metrics is available 48-96 hours after online publication and is updated daily on week days.
Initial download of the metrics may take a while.