Fig. 1
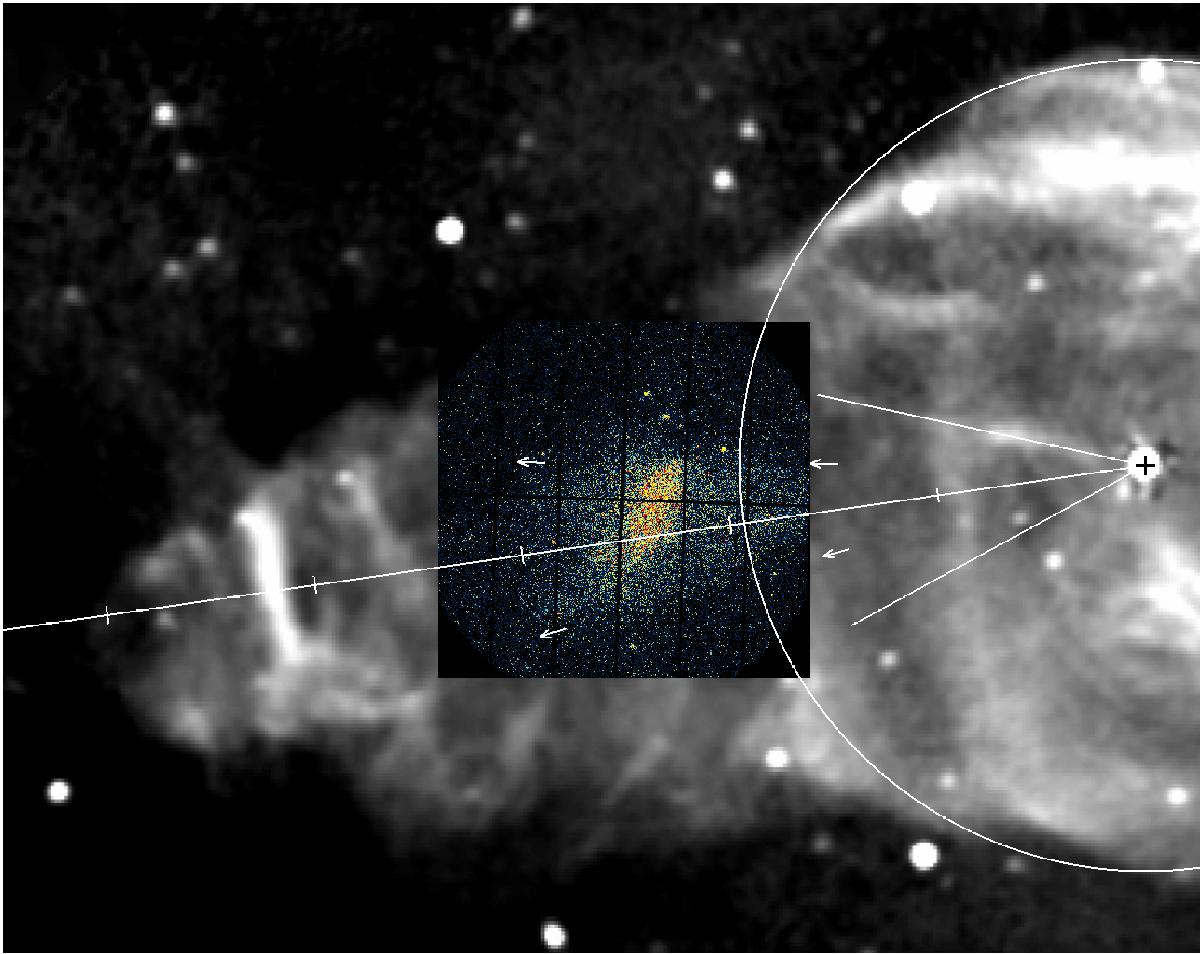
Image in 1–2 keV of the bright knot region (the XMM-Newton observatory), laid over W 50 radio image (Dubner et al. 1998), depicts the geometry of the eastern X-ray lobe in hard emission. The images are given at the epoch J2000, north is up, east is left, and SS 433 (RA = 19h11m49.s57, Dec = 04°58′57.′′9) is on the right. The spherical component of W 50, precession cone and its axis, ticked every 15′ from the beginning at SS 433 are indicated. The borders of the Watson et al. (1983) cut, for the radial profile of brightness, are delineated by arrows.
Current usage metrics show cumulative count of Article Views (full-text article views including HTML views, PDF and ePub downloads, according to the available data) and Abstracts Views on Vision4Press platform.
Data correspond to usage on the plateform after 2015. The current usage metrics is available 48-96 hours after online publication and is updated daily on week days.
Initial download of the metrics may take a while.