| Issue |
A&A
Volume 599, March 2017
|
|
|---|---|---|
| Article Number | A29 | |
| Number of page(s) | 9 | |
| Section | Planets and planetary systems | |
| DOI | https://doi.org/10.1051/0004-6361/201527529 | |
| Published online | 23 February 2017 | |
Seasonal variation of the radial brightness contrast of Saturn’s rings viewed in mid-infrared by Subaru/COMICS⋆
1 Subaru Telescope, National Astronomical Observatory of Japan, 650 North A’ohoku Place, Hilo, HI 96720, USA
e-mail: This email address is being protected from spambots. You need JavaScript enabled to view it.
2 University of California, Los Angeles, Institute of Geophysics and Planetary Physics, Los Angeles, CA 90095, USA
3 Jet Propulsion Laboratory, California Institute of Technology, Pasadena, CA 91109, USA
4 National Astronomical Observatory of Japan, 2-21-1 Osawa, Mitaka, Tokyo, 181-8588, Japan
Received: 9 October 2015
Accepted: 6 December 2016
Abstract
Aims. This paper investigates the mid-infrared (MIR) characteristics of Saturn’s rings.
Methods. We collected and analyzed MIR high spatial resolution images of Saturn’s rings obtained in January 2008 and April 2005 with the COoled Mid-Infrared Camera and Spectrometer (COMICS) mounted on the Subaru Telescope, and investigated the spatial variation in the surface brightness of the rings in multiple bands in the MIR. We also composed the spectral energy distributions (SEDs) of the C, B, and A rings and the Cassini Division, and estimated the temperatures of the rings from the SEDs assuming the optical depths.
Results. We found that the C ring and the Cassini Division were warmer than the B and A rings in 2008, which could be accounted for by their lower albedos, lower optical depths, and smaller self-shadowing effect. We also fonud that the C ring and the Cassini Division were considerably brighter than the B and A rings in the MIR in 2008 and the radial contrast of the ring brightness is the inverse of that in 2005, which is interpreted as a result of a seasonal effect with changing elevations of the Sun and observer above the ring plane.
Key words: planets and satellites: rings / infrared: planetary systems
The reduced images (FITS files) are only available at the CDS via anonymous ftp to cdsarc.u-strasbg.fr (130.79.128.5) or via http://cdsarc.u-strasbg.fr/viz-bin/qcat?J/A+A/599/A29
© ESO, 2017
1. Introduction
Ever since Saturn’s rings were first observed by Galileo Galilei about 400 years ago, a multitude of scientists have been puzzling over their true characteristics and origin. Current understanding is that Saturn’s rings consist of a set of geometrically thin disks containing cm- to m-sized particles covered mostly with water ice (see, for example, French & Nicholson 2000). In the 1980s, Voyager 1 and 2 revealed numerous remarkable fine structures in Saturn’s rings including waves, spokes, and narrow rings. Voyager also discovered that the Cassini Division was not “empty” and that there were some ringlets inside it.
One of main theories regarding the origin of Saturn’s rings is that the rings were formed by destruction of a giant moon (e.g., Charnoz et al. 2009; Canup 2010). This is very similar to the formation process of dusty debris disks around main-sequence stars. Dust grains in the disks are supplied through destruction of planetesimals or comets during the planet formation process. Recent observations with high sensitivity infrared space telescopes including AKARI and Spitzer enable us to measure the characteristics of debris disks in the mid-infrared (MIR) wavelengths precisely (e.g., Fujiwara et al. 2012, 2013). To utilize Saturn’s rings as an experiment site for understanding dust and particles in debris disks, MIR observations of Saturn’s rings and analysis of their appearance with high spatial resolution is important.
The first detection of the thermal emission of Saturn’s rings in the MIR was reported by Allen & Murdock (1971), followed by several ground-based observations using MIR photometers in the 1970s and 1980s (e.g., Rieke 1975; Nolt et al. 1978; Tokunaga et al. 1980; Froidevaux et al. 1981). In the 2000s, a few ground-based imaging observations in the MIR were reported. Spilker et al. (2003) and Ferrari et al. (2005) presented the images of Saturn’s rings at 20.5 μm taken by CAMIRAS mounted on the 3.6-m Canada-France-Hawaii Telescope (CFHT) in July 1999 and March 2000. Leyrat et al. (2008a) added the 13.0 and 17.3 μm images taken by CFHT/CAMIRAS in July 1999 and the 19.5 μm image taken by VISIR mounted on the 8.2-m Very Large Telescope (VLT) in April 2005. Those MIR images were taken when the ring opening angle was large (≳ 20°) and the radial brightness contrasts of the Saturn’s rings in the MIR images look similar to those contrasts in the visible light. In addition to ground-based observations, Spitzer also contributed to providing new infrared data of Saturn’s rings. In 2009 Spitzer discovered an enormous, geometrically-thick infrared ring around Saturn, extending from at least 128- to 207-times Saturn’s radius with an orbit tilted by 27° from the main ring plane (Verbiscer et al. 2009).
Recent observations made by Cassini using multiple onboard instruments have dramatically improved understanding of the structure of Saturn’s rings (e.g., Esposito 2011). In particular, observations of the far-infrared (FIR) thermal emission from Saturn’s rings carried out with the Focal Plane 1 (FP1, covering 17 μm–1 mm) channel of the Composite Infrared Spectrometer (CIRS) onboard Cassini allow us to investigate the physical properties of the ring material with high spatial resolution, since the wavelength range covers the peak of the blackbody emission of the ring material and therefore temperatures and filling factors could be measured simultaneously. Spilker et al. (2006) presented spatially-resolved FIR observations of thermal emission from the main rings using the FP1 channel of Cassini/CIRS in 2004 and 2005, and showed that particle temperatures decreased with increasing phase angle. Morishima et al. (2010) and Morishima et al. (2011) applied their new multilayer radiative transfer model (Morishima et al. 2009) to the data in Spilker et al. (2006) and other azimuthally-scanned CIRS spectra including those in Saturn’s shadow, and estimated radial profiles of albedo, the fraction of fast rotators, and the thermal inertia of the ring material. Altobelli et al. (2008) analyzed FP1 data of 65 radial scans of Saturn’s rings and mapped temperatures and filling factors of ring particles in a multidimensional observation space. They extensively investigated the dependence of those values on solar phase angle, spacecraft elevation and solar elevation. Leyrat et al. (2008b) also investigated the dependencies of the temperature and the filling factor on the phase angle and the local hour angle using 48 azimuthal scans of rings by CIRS (FP1) and revealed a different thermal behavior between the A, B and C rings. Flandes et al. (2010) analyzed FP1 data of Saturn’s rings, derived the temperature of the main rings from a wide variety of geometries, and confirmed that the temperature of Saturn’s main rings varied with the solar elevation angle. Altobelli et al. (2007) is the only published paper using the MIR data by the Focal Plane 3 (FP3, covering 9–17 μm) channel of CIRS, which derives radial temperature profiles for the C ring with a higher spatial resolution and reveals fine structures in the ring.
As is obvious from the results from the Cassini/CIRS observations, continuous observational efforts made at various epochs, geometries, and wavelengths are crucial in further understanding the structure and physical properties of Saturn’s rings. Even in the Cassini era, ground-based telescopes hold substantial merits for the study of Saturn’s rings as they enable us to conduct long-term observations, as well as to observe Saturn’s rings at very low phase angles and low solar elevations, which are not covered by Cassini/CIRS. In this paper, we show new high spatial resolution images of Saturn’s rings in the MIR obtained with the 8.2-m Subaru Telescope in 2008 and 2005. We also discuss interesting features of the MIR emission from Saturn’s rings including the temporal variation in the radial brightness contrast, and suggest possible causes of the variation.
2. Data and reduction
2.1. Data set of observations in 2008
Saturn and its rings were observed on January 23, 2008 (UT) with the COoled Mid-Infrared Camera and Spectrometer (COMICS; Kataza et al. 2000; Okamoto et al. 2003; Sako et al. 2003) mounted on the Subaru Telescope (Program ID: S07B-076, PI: P.A. Yanamandra-Fisher). Imaging observations using the 8.8 μm (the bandwidth Δλ = 0.8 μm), 9.7 μm (Δλ = 0.9 μm), 10.5 μm (Δλ = 1.0 μm), 11.7 μm (Δλ = 1.0 μm), 12.5 μm (Δλ = 1.2 μm), 17.7 μm (Δλ = 0.9 μm), 18.8 μm (Δλ = 0.9 μm), 20.5 μm (Δλ = 0.9 μm), and 24.5 μm (Δλ = 0.8 μm) bands were carried out.
We collected the data from the SMOKA data archive at the National Astronomical Observatory of Japan (NAOJ). The pixel scale of the COMICS detector in the imaging mode is  pixel-1. To cancel out the background radiation, the secondary mirror was chopped at a frequency of ~ 0.5 Hz with a throw of 30″. We also obtained imaging data of two MIR standard stars, HD 94336 (Cohen et al. 1999) for the N-band (8−13μm) and α Boo (Cohen et al. 1995) for the Q-band (17–25μm), taken in the same manner on the same night close to the Saturn observations for flux calibration and point spread functions (PSFs). The observations are summarized in Table 1. The astrometrical parameters of Saturn at the epoch of the observations are summarized in Table 2.
It is noted that Saturn was observed at 7.8 μm as well in the program, but the signal-to-noise ratio (SNR) in Saturn’s rings was rather low because of the poor atmospheric transparency and faint brightness of the rings at the wavelength. Therefore we do not use the 7.8 μm data in this study.
Summary of observations on January 23, 2008 and April 30, 2005 (UT).
Astrometrical parameters of observations with Subaru/ COMICS in 2008 and 2005.
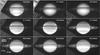 |
Fig. 1 MIR images of Saturn’s rings on January 23, 2008 (UT) as seen by COMICS mounted on the Subaru Telescope. 8.8 μm (top left), 9.7 μm (top middle), 10.5 μm (top right), 11.7 μm (middle left), 12.5 μm (middle middle), 17.7 μm (middle right), 18.8 μm (bottom left, shown with annotations of the rings’ names), 20.5 μm (bottom middle), 24.5 μm (bottom right), all of which are shown in linear scale. North is up, and east is to the left. The field of view is 47″ × 26′′. |
2.2. Data reduction
For data reduction, we used our own reduction tools and IRAF1. The standard chopping pair subtraction was employed. Flatfielding was achieved using sky frames taken immediately after the observations of Saturn. The shift-and-add method was applied for the flatfielded images and the stacked (median) image of Saturn was produced for each band.
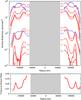 |
Fig. 2 Top: profiles of surface brightness in all the bands in 2008 (red) and 2005 (blue). Bottom: profile of 12.5μm-to-24.5μm brightness ratio for Saturn’s rings in 2008. Negative and positive value of the radius is for the east and west side, respectively. Region of the planetary body is shown in gray. |
For flux calibration, a conversion factor (from analog-to-digital unit to flux density) in each band was calculated using the reduced images of the standard stars and the photospheric models by Cohen et al. (1995, 1999). We also measured a full-width at half-maximum (FWHM) of the standard star in each band (see Table 1). Since the difference in the beam size is not negligible, we convolved the reduced Saturn images to a common spatial resolution (to that of the 24.5 μm image) so that the final images could more directly be compared with one another.
2.3. Supplementary data obtained in 2005
Imaging observations of Saturn and its rings were also carried out with COMICS on April 30, 2005 (UT) (Program ID: S05A-029, PI: P.A. Yanamandra-Fisher) using the same filter set as that employed in 2008. However, the elevation of Saturn was much lower and the integration time was shorter for some filters than the observations in 2008, and the flat data were missing, all of which affect the image quality. In addition, standard stars were observed only in the N-, 12.5, and Q-, 24.5 μm bands with a large discrepancy in airmass, resulting in unsatisfactory absolute flux calibration. Due to the circumstances, we used only 12.5 μm and 24.5 μm images, which exhibited reasonable SNRs, as supplementary data to compare with those taken in 2008. The observations are summarized in Table 1. The astrometrical parameters of Saturn at the epoch of the observations are summarized in Table 2.
The data reduction procedure was basically the same as for the 2008 data, except for the lack of flatfielding. At the flux calibration step, we applied an airmass correction by estimating the difference in atmospheric extinction between Saturn and the standard stars using ATRAN (Lord 1992).
3. Results
3.1. Saturn’s rings observed in 2008
3.1.1. Images
The processed images of Saturn in 2008 at 8.8, 9.7, 10.5, 11.7, 12.5, 17.7, 18.8, 20.5, and 24.5 μm are shown in Fig. 1. The thermal emission from the rings is clearly seen in the images, in addition to the emission from the planetary body that is brighter than the rings. The contrast of the MIR brightness of the rings to the planetary body is smaller at the longer wavelength.
An interesting feature of the rings in the MIR brightness is two bright rings that are separated by a wide, fainter region that are seen in all the bands. The inner and outer bright rings are at a distance of 76 000−86 400 km (12.̋5–14.̋1) and 117 000−121 000 km (19.̋2−19.̋7) from the planet center, corresponding to the C ring and the Cassini Division, respectively. The detection of bright thermal emission from the Cassini Division suggests the presence of a certain amount of material in the Cassini Division. The fainter region between those two bright rings corresponds to the B ring, which is the brightest in the visible light. Another faint ring just outside the Cassini Division is the A ring. The overall contrast of the MIR brightness of Saturn’s rings observed in 2008 appears to be opposite to that in the visible light2. The B ring looks like a shadow in the bright background of the planetary body, particularly in the N-band. It suggests that the B ring is opaque in the MIR.
3.1.2. Profile of MIR brightness and color
To investigate the radial variation of the MIR emission from Saturn’s rings, we extracted the averaged surface brightness in a width of four pixels (0.̋52, slightly narrower than the beam size in the 24.5 μm image) along the major axis of the projected shape of Saturn’s rings. The derived profiles of the surface brightness in the MIR are shown in the upper panel of Fig. 2. The profiles in all the bands share a similar trend. There is a bump in the innermost region (r = 70 000−90 000 km from the planet center) of the ring, corresponding to the C ring. Another bump is seen in the outer region around r = 120 000 km, which corresponds to the Cassini Division. Those two bumps are separated by a dip at r = 90 000–110 000 km, which corresponds to the B ring. Fainter emission at r ≳ 120 000 km, which corresponds to the A ring, is also detected, particularly at longer wavelengths. The contrast of the bumps to other regions is smaller at the longer wavelengths, which is probably because the B and A rings are cooler than the C ring and the Cassini Division.
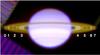 |
Fig. 3 Three-band composite image of Saturn’s rings using 12.5, 18.8, and 24.5μm. The white boxes indicate regions 0–7 (from left to right). The field of view is 47″ × 26″. |
We also calculated 12.5 μm-to-24.5 μm color (brightness ratio) of the ring profile along the major axis of the projected shape of Saturn’s rings. The resultant profile of the 12.5 μm-to-24.5 μm color of Saturn’s rings is shown in the lower panel of Fig. 2. The color of the C ring and the Cassini Division is bluer than the B and A rings, suggesting that the C ring and the Cassini Division is warmer than the B and A rings.
 |
Fig. 4 MIR SEDs of regions 0–7. Red points show the observations. Blue solid lines show the models of a single-temperature blackbody with the assumed optical depths of τ = 0.1 for the C ring and the Cassini Division, τ = 0.5 for the A ring, and τ = 1 for the B ring. Horizontal black thin lines indicate the estimated standard deviations of background in the images. |
Surface brightness of each region.
3.1.3. MIR SED of Saturn’s rings
To investigate the characteristics of Saturn’s rings such as the brightness and color in the MIR and temperature quantitatively, we composed SEDs of the surface brightness of the thermal emission from selected regions in Saturn’s rings based on the images taken by COMICS. The brightnesses of the detected emission were calibrated reasonably well by observing the flux calibrators (Cohen et al. 1999) in all the bands. Eight regions, which correspond to the east and west sides of the C, B, and A rings and the Cassini Division, were defined as shown in Fig. 3. We measured the averaged surface brightness in each region in each band (Table 3), and composed the SEDs (Fig. 4). It is noted that the region 0 (the east ansa of the A ring) is partly out of the field of view and and no reliable measurement is available at 8.8, 9.7, 10.5 and 11.7μm. We also estimated standard deviations of the background in a blank region at each band (shown in Table 3 and Fig. 4), and treated them as photometric errors. The SEDs from 8.8 to 24.5 μm all show a blackbody-like smooth shape with a rising surface brightness as the wavelength increases. The peak of the emission from Saturn’s rings is located at λ> 25 μm, suggesting that the rings are cooler than 200 K.
Temperatures of each region in 2008 derived from the COMICS-observed SED by assuming the optical depths.
The SEDs of the rings measured in the COMICS images, Iν(λ), can be modeled simply by 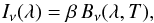 (1)where β is the filling factor of particles in the rings and Bν(λ,T) is the Planck function of the temperature T. The filling factor is expressed analytically by
  (2)where τ is the normal optical depth of the rings and B the elevation of the observer above the ring plane.
The optical depths of Saturn’s rings have been measured from stellar occultations. Stellar occultation observations by the Ultraviolet Imaging Spectrograph Subsystem (UVIS) onboard Cassini provide the profiles of the optical depths in Saturn’s rings at a spatial resolution of 10 km or higher. The UVIS measurements indicate the optical depths for both the C ring and the Cassini Division average at τ ~ 0.1 partly ranging from ~ 0.05 to ~ 0.2, while those of the B and A rings are τ ≳ 1 and τ ≳ 0.5, respectively (Colwell et al. 2009, 2010).
For each region, we derived the ring temperature T as the value that minimizes the weighted residual between the measured SED and a model spectrum defined by Eq. (1), assuming the optical depths of τ = 0.1 for the C ring and the Cassini Division, τ = 1 for the B ring, and τ = 0.5 for the A ring. The photometric errors (i.e., the background standard deviations) were fully taken into account in the residual minimization process. We also calculated T by changing τ by a factor of two to see the dependency on the assumed optical depth. Temperatures derived with the assumed optical depth of each region are listed in Table 4. The ring temperature estimated from the COMICS images is T = 97–100 K for the C ring (Regions 3 and 4), T = 82−84 K for the B ring (Regions 2 and 5), T = 78–80 K for the A ring (Regions 0 and 7), and T = 91–93 K for the Cassini Division (Regions 1 and 6). The uncertainty in the derived T in the SED fitting is ≲ 1 K for all the regions. A considerable radial variation in temperature of the rings is found – the C ring is the warmest, the Cassini Division second, the B ring third, and the A ring fourth among the investigated regions. We note that the derived temperature of the narrow Cassini Division might be underestimated due to possible photometric contamination from the adjoining B and A rings. However the overall contrast in the temperatures of C, B, and A rings and the Cassini Division presented here is secure.
The best-fit SEDs of the eight regions are shown in Fig. 4. As can be seen, the SEDs observed in all the regions can be represented reasonably well by a single-temperature blackbody. It is noted that all the SEDs exhibit a hint of a small bump over the continuum at around 11.7 μm in all the regions. Lynch et al. (2000) presented featureless spectra of the A and B rings in the N-band (at B = 19.1° and B′ = 20.6°) taken at the 3-m Infrared Telescope Facility on June 16, 1991 (UT). Future N-band spectroscopic observations with higher accuracies at similar B and B′ are required to confirm the possible feature in Saturn’s rings.
3.2. Saturn’s rings observed in 2005
The processed images of Saturn’s rings in 2005 at 12.5 and 24.5 μm are shown in the upper panels of Fig. 5 (those taken in 2008 are also displayed in the lower panels as comparisons). The radial profiles of the surface brightness are overplotted on the 2008 data in Fig. 2. The images are consistent with the ones presented by Fletcher et al. (2009), who discussed the atmospheric features of Saturn itself using the same COMICS data set as this study. Leyrat et al. (2008a) also presented an image of Saturn in 2005 observed at 19.5μm using VLT/VISIR. Their image showed similar characteristics to those captured at 24.5 μm by COMICS.
In contrast to 2008, the B ring is the brightest, the A rings the second, and the C ring and the Cassini Division are fainter in the 24.5 μm image taken in 2005. The overall radial brightness contrast of Saturn’s rings at 24.5 μm observed in 2005 is similar to the image in the visible light.
The rings in the 12.5 μm image in 2005 seem relatively flat in surface brightness, which is also different from the 2008 image. In addition, a few narrow bright features can be seen in the B and C rings. The B ring looks opaque, while the C ring and the Cassini Division are relatively transparent, when seen against the background of the planetary body.
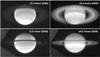 |
Fig. 5 Comparison of MIR images of Saturn’s rings in 2005 (top) and 2008 (bottom). 12.5 μm (left) and 24.5 μm (right). The images in 2005 are scaled by the distance to the observer to show the same region as the 2008 images. The field of view of each panel is 47″ × 26″. |
4. Discussion
4.1. Spatial variations in temperature
We estimated the temperatures of the C, B, and A rings and the Cassini Division from the MIR images taken by COMICS in 2008 by assuming the optical depths. We found that the C ring was the warmest and the Cassini Division second, the B ring third, and the A ring fourth at the epoch of the observations in 2008.
Higher temperatures of the C ring and the Cassini Division compared with the B and A rings are accounted for by their lower albedos, which might be a result of the pollution of ring material due to meteoroid bombardment (Cuzzi & Estrada 1998). At the same time, the lower optical depths of the C ring and the Cassini Division could also contribute to their higher temperatures since lower optical depths reduce mutual obscuration and shadowing between particles in the rings (Spilker et al. 2006). We note that our measurements suggest that the temperature at the east (morning) ansa is slightly lower than that at the west (afternoon) ansa of each ring. This could be accounted for by eclipse cooling in Saturn’s shadow.
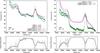 |
Fig. 6 Top: profiles of ring temperature in 2005 (left) and 2008 (right), calculated from the COMICS-measured MIR SEDs and the particle filling factors based on the Cassini/UVIS-measured optical depths. Blue and red lines indicate the east (morning) and west (afternoon) ansae, respectively. Ring temperatures based on the Cassini/CIRS FP1 data are also overplotted. Bottom: profiles of the particle filling factors with the radial resolution of 10 km of the original UVIS data products (gray lines) and those are smoothed with the beam sizes of COMICS (black thick lines). |
4.2. C ring and Cassini Division brighter than B and A rings in 2008
One of the most interesting features in Saturn’s rings seen in our COMICS images taken in 2008 is an inversion of the contrast of the MIR surface brightness in the C, B, and A rings and the Cassini Division, compared with the visible image. The C ring and the Cassini Division were brighter than the B and A rings in the MIR in 2008. Saturn was observed in the MIR in 2005 by Subaru/COMICS (this work; Fletcher et al. 2009) and VLT/VISIR (Leyrat et al. 2008a). The overall radial contrast of the MIR brightness in 2005 appears to be the inverse of that in 2008 and is similar to images in the visible light; there is a dip in the surface brightness at the position of the Cassini Division, and the C ring and the Cassini Division are fainter than the B and A rings in the Q-band.
The surface brightness of a ring in the thermal emission is expressed as a product of the particle filling factor and the Planck function of the temperature (see Eq. (1)). Our COMICS measurements at low α suggest the temperature contrast between optically thick, cooler rings (the B and A rings) and optically thin, warmer rings (the C ring and Cassini Division) is larger at a low B′ (or B) in 2008 than at a high B′ (or B) in 2005. On the other hand, the contrast in the particle filling factors seen by us is smaller in 2008 than in 2005. Both of the contrast changes in the ring temperatures and filling factors result in a brighter C and Cassini Division than B and A rings in the MIR in 2008 as seen in our images.
To summarize, the inversion of the MIR contrast of Saturn’s rings from 2005 to 2008, which made the C ring and the Cassini Division brighter than the B and A rings in 2008, is accounted for by a seasonal effect with changing elevations of the Sun and observer above the ring plane. In 2008, higher temperatures of the C ring and the Cassini Division compared with the B and A rings, and the increased filling factors of particles in the C ring and the Cassini Division, resulted in the higher MIR surface brightness of the C ring and the Cassini Division than the B and A rings. Although the temperatures of the C ring and the Cassini Division are higher than the B and A rings also in 2005, their low filling factors result in relatively lower brightnesses compared with the B and A rings.
Froidevaux (1981) compiled a list of brightness temperatures of the A, B, and C rings measured at 20 μm at various B′ from the literature by different groups and instruments. The paper suggested that the C ring is brighter than the B and A rings at | B | ~ | B′ | ≲ 11° (see Table 1 in Froidevaux 1981). Our images of Saturn’s rings from the single instrument, COMICS, show new, clearly visualized evidence of the higher MIR surface brightness of the Cassini Division as well as the C ring, as compared to that of the B and A rings at a lower elevation of the Sun and observer above the ring plane. The present work resolves the Cassini Division in the thermal emission by ground-based observations for the first time.
Astrometrical parameters of observations with Cassini/CIRS in 2005 and 2008.
We note that, unlike in the thermal emission, seasonal reversal of brightness contrast over the rings does not occur in the visible light (for instance, see Fig. 1 in Cuzzi et al. 2002 for images of Saturn rings at various solar elevations observed by the Hubble Space Telescope). This is simply because the reflected brightnesses of the C ring and the Cassini Division, which have low albedo particles, are always lower than those for the B and A rings even after filling factor corrections.
4.3. Comparison with Cassini/CIRS temperature
To make a direct comparison of the ring temperatures by COMICS with those by Cassini/CIRS, we computed the temperature profiles from the MIR brightnesses measured by COMICS (shown in Fig. 2). A radial profile of the normal optical depth in the rings (PRODUCT ID: UVIS_HSP_ 2006_256_LAMCET_I_TAU_10KM.TAB) measured from stellar occultation observations by Cassini/UVIS3 (Colwell et al. 2009, 2010) was converted to the particle filling factors at the epoch of COMICS observations in 2005 and 2008 by Eq. (2), and then smoothed with the COMICS’ PSFs at 24.5 μm. We performed fits with an SED model defined by Eq. (1) and derived the ring temperature at each radius.
The resultant profiles of the ring temperature are shown in Fig. 6. The achieved spatial resolution of the profiles is ~ 4000 km, and, to our best knowledge, seems the highest ever reported from ground-based observations. The temperatures in 2008 are consistent with the values estimated for the selected eight regions shown in Table 4. Both in 2005 and 2008, the east (morning) ansa is cooler than the west (afternoon) ansa over the rings, which could be accounted for by eclipse cooling in Saturn’s shadow.
Cassini/CIRS has been making a huge number of observations of Saturn’s rings since 2004. For comparison with our COMICS results, CIRS FP1 data of three radial scans in 2005 and one in 2008 with close observational epoch to the COMICS observations, and close solar elevation above the ring plane to the COMICS observations were collected. The astrometrical parameters of Saturn at the epoch of the CIRS observations are summarized in Table 5. The ring temperatures in each scan were derived from fits with a spectral model of blackbody emission (e.g., Spilker et al. 2006; Altobelli et al. 2008).
In Fig. 6, ring temperature profiles measured by CIRS are overplotted on the COMICS data. The profiles measured by COMICS in 2005 are compared with those by CIRS in 2005 at the phase angle of α = 0.3, 9.3, 31.0°, and are in agreement with them. It is noted that the COMICS measurements at α = 6.1° suggest slightly higher temperatures than the CIRS data at similar phase angles (α = 0.3 and 9.3°), which might be due to the difference in the observation wavelength. MIR observations by COMICS should be more sensitive to warmer particles in the rings than FIR observations by the CIRS FP1 channel. The compiled data by COMICS and CIRS in 2005 suggest little change in the ring temperature profile between α ~ 0° and ~ 30° at a large solar elevation above the ring plane (B′ ~ −22°).
The temperature profile measured by COMICS in 2008 is compared with that by CIRS in 2008 at α = 27.4°. Although the global trends of temperature profiles shown by COMICS and CIRS are similar to each other, COMICS’ measurements provide significantly higher temperatures than CIRS. At a lower solar elevation above the ring plane, Saturn’s ring temperatures show more notable dependence on the phase angle. The dependence is interpreted as a shadowing effect of particles in the rings: a larger shadowed area in the rings appears to the observer at a larger phase angle, while no shadows would be seen at α ~ 0. At a lower solar elevation, the shadowed fractional area in the rings is larger (e.g., Froidevaux 1981; Flandes et al. 2010), and thus the dependence of the ring temperatures on the phase angle is stronger than at a higher elevation. Our COMICS images of Saturn’s rings presented in this work are complementary to CIRS observations, which did not cover very low phases (α< 20°) at low solar elevations (| B′ | < 10°). Future application of the surface model of Saturn’s rings and ring particles (Morishima et al. 2017) to our COMICS data would give us an insight into the influences of intra-particle shadows caused by the surface roughness of individual particles and inter-particle shadowing on the physical properties in the rings at various geometries.
5. Summary
Multi-band MIR images of Saturn’s rings in 2008 and 2005 observed by Subaru/COMICS were presented. We found that the C ring and the Cassini Division were warmer than the B and A rings in 2008. The C ring and the Cassini Division have lower albedos, lower optical depths, and a smaller self-shadowing effect than the B and A rings, all of which are likely to contribute to the higher temperatures in the C ring and the Cassini Division. We also found that the radial profile of the MIR emission contrast of Saturn’s rings in 2008 was the inverse of that in 2005, and that the C ring and the Cassini Division were much brighter than the B and A rings in 2008. This temporal variation is probably caused by seasonal changes of the elevations of the Sun and observer above the ring plane as varying angles will lead to differing filling factors and temperatures of the particles in the rings.
IRAF is distributed by the National Optical Astronomy Observatory, which is operated by the Association of Universities for Research in Astronomy under cooperative agreement with the National Science Foundation.
A visible image of Saturn taken on March 16, 2008 (Japan Standard Time) by the 105-cm Murikabushi Telescope at NAOJ Ishigakijima Observatory in Okinawa, Japan is available at http://www.miz.nao.ac.jp/ishigaki/system/files/Sat_IAO_080316.jpg
Data retrieved from The Ring-Moon Systems Node of NASA’s Planetary Data System http://pds-rings.seti.org
Acknowledgments
This research is based on data collected at the Subaru Telescope and obtained from the SMOKA, which is operated by the Astronomy Data Center (ADC), NAOJ. Data analysis were in part carried out on common use data analysis computer system at ADC. We appreciate the referee, L. Spilker, for her comments which have greatly helped to improve the manuscript. We are deeply grateful to P. A. Yanamandra-Fisher, G. S. Orton, and L. N. Fletcher, the core members of the original observing team with COMICS, who gave us very helpful comments, and also to the other members, B. Fisher, T. Fuse, T. Greathouse, N. Takato, H. Kawakita, R. Furusho, and S. Takeuchi. We thank H. Kobayashi, D. Kinoshita, and T. Onaka for their suggestions and supports. This work benefited from fruitful discussions with A. T. Tokunaga, T. Kostiuk, and other participants at the ESO workshop “Ground and space observatories: a joint venture to planetary science” in March 2015, chaired by E. Villard and O. Witasse. This work was supported by JSPS KAKENHI Grant Numbers JP23103002 and JP26800110. H.F. dedicates this paper to his son Kimihiro, who was born just a few days after the submission of the original manuscript and caused a worthwhile delay of the publication of this paper.
References
- Allen, D. A., & Murdock, T. L. 1971, Icarus, 14, 1 [NASA ADS] [CrossRef] [Google Scholar]
- Altobelli, N., Spilker, L., Pilorz, S., et al. 2007, Icarus, 191, 691 [NASA ADS] [CrossRef] [Google Scholar]
- Altobelli, N., Spilker, L. J., Leyrat, C., & Pilorz, S. 2008, Planet. Space Sci., 56, 134 [NASA ADS] [CrossRef] [Google Scholar]
- Canup, R. M. 2010, Nature, 468, 943 [NASA ADS] [CrossRef] [Google Scholar]
- Charnoz, S., Morbidelli, A., Dones, L., & Salmon, J. 2009, Icarus, 199, 413 [NASA ADS] [CrossRef] [Google Scholar]
- Cohen, M., Witteborn, F. C., Walker, R. G., Bregman, J. D., & Wooden, D. H. 1995, AJ, 110, 275 [NASA ADS] [CrossRef] [Google Scholar]
- Colwell, J. E., Esposito, L. W., Jerousek, R. G., et al. 2010, AJ, 140, 1569 [NASA ADS] [CrossRef] [Google Scholar]
- Cohen, M., Walker, R. G., Carter, B., et al. 1999, AJ, 117, 1864 [NASA ADS] [CrossRef] [Google Scholar]
- Colwell, J. E., Nicholson, P. D., Tiscareno, M. S., et al. 2009, The Structure of Saturn’s Rings, eds. M. K. Dougherty, L. W. Esposito, & S. M. Krimigis, 375 [Google Scholar]
- Cuzzi, J. N., & Estrada, P. R. 1998, Icarus, 132, 1 [NASA ADS] [CrossRef] [Google Scholar]
- Cuzzi, J. N., French, R. G., & Dones, L. 2002, Icarus, 158, 199 [NASA ADS] [CrossRef] [Google Scholar]
- Esposito, L. W. 2011, Planetary Rings (Cambridge, UK: Cambridge University Press) [Google Scholar]
- Ferrari, C., Galdemard, P., Lagage, P. O., Pantin, E., & Quoirin, C. 2005, A&A, 441, 379 [NASA ADS] [CrossRef] [EDP Sciences] [Google Scholar]
- Flandes, A., Spilker, L., Morishima, R., et al. 2010, Planet. Space Sci., 58, 1758 [NASA ADS] [CrossRef] [Google Scholar]
- Fletcher, L. N., Orton, G. S., Yanamandra-Fisher, P., et al. 2009, Icarus, 200, 154 [NASA ADS] [CrossRef] [Google Scholar]
- French, R. G., & Nicholson, P. D. 2000, Icarus, 145, 502 [NASA ADS] [CrossRef] [Google Scholar]
- Froidevaux, L. 1981, Icarus, 46, 4 [NASA ADS] [CrossRef] [Google Scholar]
- Froidevaux, L., Matthews, K., & Neugebauer, G. 1981, Icarus, 46, 18 [NASA ADS] [CrossRef] [Google Scholar]
- Fujiwara, H., Onaka, T., Takita, S., et al. 2012, ApJ, 759, L18 [NASA ADS] [CrossRef] [Google Scholar]
- Fujiwara, H., Ishihara, D., Onaka, T., et al. 2013, A&A, 550, A45 [NASA ADS] [CrossRef] [EDP Sciences] [Google Scholar]
- Kataza, H., Okamoto, Y., Takubo, S., et al. 2000, in SPIE Conf. Ser. 4008, eds. M. Iye, & A. F. Moorwood, 1144 [Google Scholar]
- Leyrat, C., Ferrari, C., Charnoz, S., et al. 2008a, Icarus, 196, 625 [NASA ADS] [CrossRef] [Google Scholar]
- Leyrat, C., Spilker, L. J., Altobelli, N., Pilorz, S., & Ferrari, C. 2008b, Planet. Space Sci., 56, 117 [NASA ADS] [CrossRef] [Google Scholar]
- Lord, S. D. 1992, A new software tool for computing Earth’s atmospheric transmission of near- and far-infrared radiation, Tech. Rep. [Google Scholar]
- Lynch, D. K., Mazuk, A. L., Russell, R. W., Hackwell, J. A., & Hanner, M. S. 2000, Icarus, 146, 43 [NASA ADS] [CrossRef] [Google Scholar]
- Morishima, R., Salo, H., & Ohtsuki, K. 2009, Icarus, 201, 634 [NASA ADS] [CrossRef] [Google Scholar]
- Morishima, R., Spilker, L., Salo, H., et al. 2010, Icarus, 210, 330 [NASA ADS] [CrossRef] [Google Scholar]
- Morishima, R., Spilker, L., & Ohtsuki, K. 2011, Icarus, 215, 107 [NASA ADS] [CrossRef] [Google Scholar]
- Morishima, R., Turner, N., & Spilker, L. 2017, Icarus, submitted [Google Scholar]
- Nolt, I. G., Tokunaga, A., Gillett, F. C., & Caldwell, J. 1978, ApJ, 219, L63 [NASA ADS] [CrossRef] [Google Scholar]
- Okamoto, Y. K., Kataza, H., Yamashita, T., et al. 2003, in SPIE Conf. Ser., eds. M. Iye, & A. F. M. Moorwood, 169 [Google Scholar]
- Rieke, G. H. 1975, Icarus, 26, 37 [NASA ADS] [CrossRef] [Google Scholar]
- Sako, S., Okamoto, Y. K., Kataza, H., et al. 2003, PASP, 115, 1407 [NASA ADS] [CrossRef] [Google Scholar]
- Spilker, L., Ferrari, C., Cuzzi, J. N., et al. 2003, Planet. Space Sci., 51, 929 [NASA ADS] [CrossRef] [Google Scholar]
- Spilker, L. J., Pilorz, S. H., Wallis, B. D., et al. 2006, Planet. Space Sci., 54, 1167 [NASA ADS] [CrossRef] [Google Scholar]
- Tokunaga, A. T., Caldwell, J., & Nolt, I. G. 1980, Nature, 287, 212 [NASA ADS] [CrossRef] [Google Scholar]
- Verbiscer, A. J., Skrutskie, M. F., & Hamilton, D. P. 2009, Nature, 461, 1098 [NASA ADS] [CrossRef] [Google Scholar]
All Tables
Temperatures of each region in 2008 derived from the COMICS-observed SED by assuming the optical depths.
All Figures
|
Fig. 1 MIR images of Saturn’s rings on January 23, 2008 (UT) as seen by COMICS mounted on the Subaru Telescope. 8.8 μm (top left), 9.7 μm (top middle), 10.5 μm (top right), 11.7 μm (middle left), 12.5 μm (middle middle), 17.7 μm (middle right), 18.8 μm (bottom left, shown with annotations of the rings’ names), 20.5 μm (bottom middle), 24.5 μm (bottom right), all of which are shown in linear scale. North is up, and east is to the left. The field of view is 47″ × 26′′. |
| In the text | |
|
Fig. 2 Top: profiles of surface brightness in all the bands in 2008 (red) and 2005 (blue). Bottom: profile of 12.5μm-to-24.5μm brightness ratio for Saturn’s rings in 2008. Negative and positive value of the radius is for the east and west side, respectively. Region of the planetary body is shown in gray. |
| In the text | |
|
Fig. 3 Three-band composite image of Saturn’s rings using 12.5, 18.8, and 24.5μm. The white boxes indicate regions 0–7 (from left to right). The field of view is 47″ × 26″. |
| In the text | |
|
Fig. 4 MIR SEDs of regions 0–7. Red points show the observations. Blue solid lines show the models of a single-temperature blackbody with the assumed optical depths of τ = 0.1 for the C ring and the Cassini Division, τ = 0.5 for the A ring, and τ = 1 for the B ring. Horizontal black thin lines indicate the estimated standard deviations of background in the images. |
| In the text | |
|
Fig. 5 Comparison of MIR images of Saturn’s rings in 2005 (top) and 2008 (bottom). 12.5 μm (left) and 24.5 μm (right). The images in 2005 are scaled by the distance to the observer to show the same region as the 2008 images. The field of view of each panel is 47″ × 26″. |
| In the text | |
|
Fig. 6 Top: profiles of ring temperature in 2005 (left) and 2008 (right), calculated from the COMICS-measured MIR SEDs and the particle filling factors based on the Cassini/UVIS-measured optical depths. Blue and red lines indicate the east (morning) and west (afternoon) ansae, respectively. Ring temperatures based on the Cassini/CIRS FP1 data are also overplotted. Bottom: profiles of the particle filling factors with the radial resolution of 10 km of the original UVIS data products (gray lines) and those are smoothed with the beam sizes of COMICS (black thick lines). |
| In the text | |
Current usage metrics show cumulative count of Article Views (full-text article views including HTML views, PDF and ePub downloads, according to the available data) and Abstracts Views on Vision4Press platform.
Data correspond to usage on the plateform after 2015. The current usage metrics is available 48-96 hours after online publication and is updated daily on week days.
Initial download of the metrics may take a while.