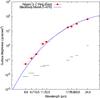
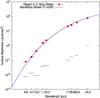
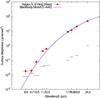
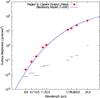
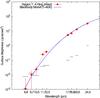
Fig. 4
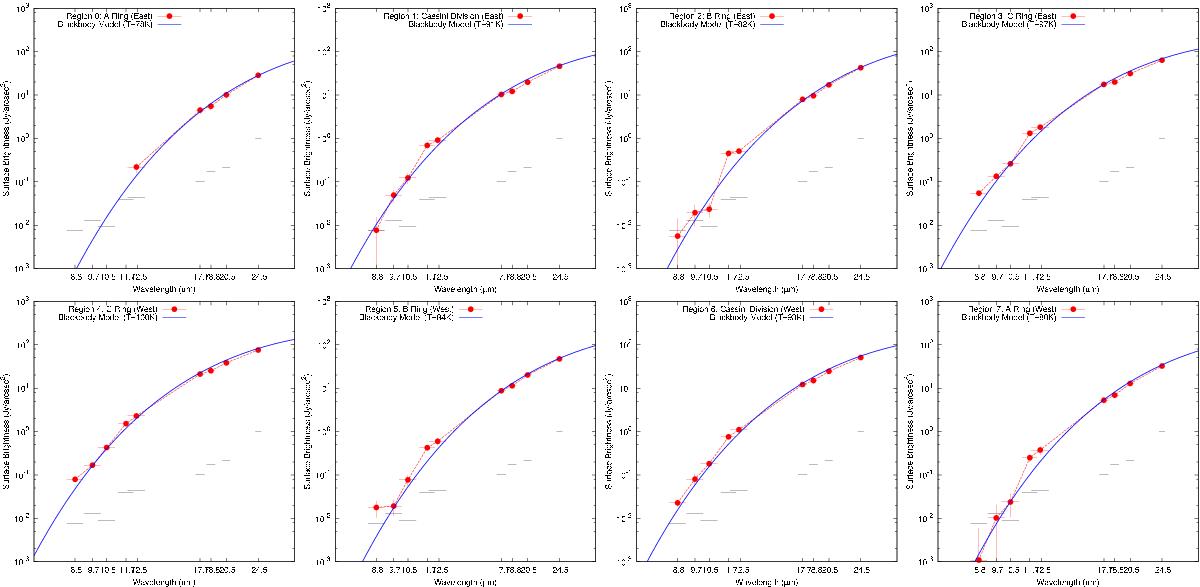
MIR SEDs of regions 0–7. Red points show the observations. Blue solid lines show the models of a single-temperature blackbody with the assumed optical depths of τ = 0.1 for the C ring and the Cassini Division, τ = 0.5 for the A ring, and τ = 1 for the B ring. Horizontal black thin lines indicate the estimated standard deviations of background in the images.
Current usage metrics show cumulative count of Article Views (full-text article views including HTML views, PDF and ePub downloads, according to the available data) and Abstracts Views on Vision4Press platform.
Data correspond to usage on the plateform after 2015. The current usage metrics is available 48-96 hours after online publication and is updated daily on week days.
Initial download of the metrics may take a while.