| Issue |
A&A
Volume 598, February 2017
|
|
|---|---|---|
| Article Number | A17 | |
| Number of page(s) | 12 | |
| Section | Catalogs and data | |
| DOI | https://doi.org/10.1051/0004-6361/201629487 | |
| Published online | 25 January 2017 | |
2WHSP: A multi-frequency selected catalogue of high energy and very high energy γ-ray blazars and blazar candidates⋆
1 Sapienza Università di Roma, ICRANetDipartimento di Fisica, Piazzale Aldo Moro 5, 00185 Roma, Italy
e-mail: This email address is being protected from spambots. You need JavaScript enabled to view it.
2 Italian Space Agency, ASI, via del Politecnico snc, 00133 Roma, Italy
3 ICRANet, P.zza della Repubblica 10, 65122 Pescara, Italy
4 ICRANet-Rio, CBPF, Rua Dr. Xavier Sigaud 150, 22290-180 Rio de Janeiro, Brazil
5 European Southern Observatory, Karl-Schwarzschild-Str. 2, 85748 Garching bei München, Germany
6 Associated to INAF–Osservatorio Astronomico di Roma, via Frascati 33, 00040 Monteporzio Catone, Italy
e-mail: This email address is being protected from spambots. You need JavaScript enabled to view it.
Received: 5 August 2016
Accepted: 18 September 2016
Abstract
Aims. High synchrotron peaked blazars (HSPs) dominate the γ-ray sky at energies higher than a few GeV; however, only a few hundred blazars of this type have been cataloged so far. In this paper we present the 2WHSP sample, the largest and most complete list of HSP blazars available to date, which is an expansion of the 1WHSP catalogue of γ-ray source candidates off the Galactic plane.
Methods. We cross-matched a number of multi-wavelength surveys (in the radio, infrared and X-ray bands) and applied selection criteria based on the radio to IR and IR to X-ray spectral slopes. To ensure the selection of genuine HSPs, we examined the SED of each candidate and estimated the peak frequency of its synchrotron emission (νpeak) using the ASDC SED tool, including only sources with νpeak > 1015 Hz (equivalent to νpeak > 4 eV).
Results. We have assembled the largest and most complete catalogue of HSP blazars to date, which includes 1691 sources. A number of population properties, such as infrared colours, synchrotron peak, redshift distributions, and γ-ray spectral properties have been used to characterise the sample and maximize completeness. We also derived the radio log N–log S distribution. This catalogue has already been used to provide seeds to discover new very high energy objects within Fermi-LAT data and to look for the counterparts of neutrino and ultra high energy cosmic ray sources, showing its potential for the identification of promising high-energy γ-ray sources and multi-messenger targets.
Key words: galaxies: active / BL Lacertae objects: general / radiation mechanisms: non-thermal / gamma rays: galaxies
Table 4 is only available at the CDS via anonymous ftp to cdsarc.u-strasbg.fr (130.79.128.5) or via http://cdsarc.u-strasbg.fr/viz-bin/qcat?J/A+A/598/A17
© ESO, 2017
1. Introduction
Blazars are a class of radio-loud active galactic nuclei (AGN) hosting a jet oriented at a small angle with respect to the line of sight (Blandford & Rees 1978; Antonucci 1993; Urry & Padovani 1995). The emission of these objects is non-thermal over most or the entire electromagnetic spectrum, from radio frequencies to hard γ-rays. The observed radiation shows extreme properties, mostly owing to relativistic amplification effects. The observed spectral energy distribution (SED) presents a general shape composed of two bumps, one typically located in the infrared (IR), and sometimes extending to the X-ray band, and the other in the hard X-ray to γ-rays. If the peak frequency of the synchrotron bump (νpeak) in ν−νFν space is larger than 1015 Hz (corresponding to ~4 eV), a source is usually called high synchrotron peaked (HSP) blazars (Padovani & Giommi 1995; Abdo et al. 2010). HSP blazars are also considered as extreme sources since the Lorentz factor of the electrons radiating at the peak of the synchrotron bump γpeak are the highest within the blazar population, and likely of any other type of steady cosmic sources. Considering a simple SSC model, where  (e.g. Giommi et al. 2012), assuming B = 0.1 Gauss and Doppler factor δ = 10, HSPs characterized by νpeak ranging between 1015 and ≳1018 Hz demand γpeak ≈ 104−106.
The typical two-bump SED of blazars and the high energies that characterize HSPs imply that these objects occupy a distinct position in the optical to X-ray spectral index (αox) versus the radio to optical spectral index (αro) colour–colour diagram (Stocke et al. 1991). Considering the distinct spectral properties of blazars over the whole electromagnetic spectrum, selection methods based on αox and αro have long been used to search for new blazars. For example, Schachter et al. (1993) discovered 10 new BL Lacs via a multi-frequency approach with radio, optical, and X-ray data, and their BL Lac nature with optical spectra.
HSP blazars play a crucial role in very high energy (VHE) astronomy. Observations have shown that HSPs are bright and variable sources of high energy γ-ray photons (TeVCat)1 and that they are likely the dominant component of the extragalactic VHE background (Padovani et al. 1993; Giommi et al. 2006; Di Mauro et al. 2014; Giommi & Padovani 2015; Ajello et al. 2015). In fact, most of the extragalactic objects detected so far above a few GeV are HSPs (Giommi et al. 2009; Padovani & Giommi 2015; Arsioli et al. 2015; Ackermann et al. 2016, see also TeVCat). However, only a few hundred HSP blazars are above the sensitivity limits of currently available γ-ray surveys. For example, the 1WHSP catalogue (Arsioli et al. 2015, hereafter Paper I), which was the largest sample of HSP blazars when it was published, shows that out of the 992 objects in the sample, 299 have an associated γ-ray counterpart in the Fermi 1/2/3FGL catalogues. Nevertheless there is a considerable number of relatively bright HSPs which still lack a γ-ray counterpart. These are likely faint, point-like sources at or below the Fermi-LAT, detectability threshold and were not found by the automated searches carried out so far. Indeed, Arsioli & Chang (2016) have detected ≈150 new γ-ray blazars based on a specific search around bright WHSP sources, using over seven years of Fermi-LAT Pass 8 data.
In the most energetic part of the γ-ray band photons from high redshift sources are absorbed by the extragalactic background light (EBL) emitted by galaxies and quasars (Dermer et al. 2011; Pfrommer et al. 2013; Bonnoli et al. 2015). Therefore, the TeV flux can drop by a very large factor compared to GeV fluxes, making distant TeV sources much more difficult to detect. Paper I has shown that, with the help of multi-wavelength analysis, HSP catalogues can provide many good candidates for VHE detection.
The currently known HSP blazars are listed in catalogues such as the 5th Roma-BZCAT (Massaro et al. 2015, hereafter 5BZCat), the Sedentary Survey (Giommi et al. 1999, 2005; Piranomonte et al. 2007), Kapanadze (2013), and Paper I. However, the number of known HSPs is still relatively small with less than ≈1000 cataloged HSPs till now. Significantly enlarging the number of high energy blazars is important to better understand their role within the AGN phenomenon, and should shed light on the cosmological evolution of blazars, which is still a matter of debate.
The 5BZCat is the largest compilation of confirmed blazars, containing 3561 sources, around 500 of which are of the HSP type. It includes blazars discovered in surveys carried out in all parts of the electromagnetic spectrum and is also based on an extensive review of the literature and optical spectra. The Sedentary Survey comprises 150 extremely high X-ray to radio flux ratio (log fx/fr ≥ 3 × 10⁻¹⁰ erg cm-2 s-1 Jy-1) HSP BL Lacs. The sample was obtained by cross-matching the RASS catalogue of bright X-ray sources (Voges et al. 1999) and the NVSS 1.4 GHz radio catalogue (Condon et al. 1998). Kapanadze (2013) built a catalogue of 312 HSPs with flux ratio (fx/fr ≥ 10-11 erg cm-2 s-1 Jy-1) selected from various X-ray catalogues, the NVSS catalogue of radio sources, and the first edition of the Roma - BZCAT catalogue (Massaro et al. 2009). The 1WHSP sample relied on a pre-selection based on Wide-field Infrared Survey Explorer (WISE) IR colours, SED slope criteria, and νpeak > 1015 Hz. It includes 992 known, newly-identified, and candidate high galactic latitude (b> | 20° |) HSPs.
In a series of papers, Massaro et al. (2011, 2012), D’Abrusco et al. (2012) show that most blazars occupy a specific region of the IR colour–colour diagram, which they termed the blazar strip. In Paper I, we extended the blazar strip in the WISE colour–colour diagram to include all the Sedentary Survey blazars and called it the Sedentary WISE colour domain (SWCD). The SWCD is wider than the WISE blazar strip since it contains some blazars whose host galaxy is very bright, such as MKN421 (2WHSP J110427.3+381230) and MKN 501 (2WHSP J165353.2+394536). We understood from previous works that many low-luminosity HSP blazars have the IR colours dominated by the thermal component of the host giant elliptical galaxy. Therefore, a selection scheme adopting IR colour restrictions may work effectively for selecting cases where the non-thermal jet component dominates the IR band but is less efficient for selecting galaxy-dominated sources (since they are spread over a larger area in the IR colour–colour plot).
In the present paper, we extend the previous 1WHSP catalogue to lower Galactic latitudes (b> | 10° |) building the larger and more complete 2WHSP catalogue including over 1600 blazars expected to emit at VHE energies by means of multi-frequency data.
2. Building the largest sample of HSP blazars
2.1. Initial data selection by spatial cross-matching
Blazars are known to emit electromagnetic radiation over a very wide spectral range, from radio to VHE photons. As discussed in Paper I, an effective way of building large blazar samples is to work with multi-frequency data, especially from all-sky surveys, and to apply selection criteria based on spectral features that are known to be specific to blazar SEDs.
We followed Paper I and started by cross-matching the AllWISE whole sky infrared catalogue (Cutri et al. 2013) with three radio surveys (NVSS, FIRST, and SUMSS: Condon et al. 1998; White et al. 1997; Manch et al. 2003). To take into account the positional uncertainties associated with each target, we used matching radii of 0.3 arcmin for the NVSS and the SUMSS surveys and 0.1 arcmin for the FIRST catalogue. Then we performed an internal match for all IR-radio sources to eliminate duplicate entries coming from the different radio catalogues. Keeping only the best matches between radio and IR, we selected 2 137 505 objects.
After this we demanded all radio-IR matching sources to have a counterpart in one of the X-ray catalogues available to us (RASS BSC and FSC, 1SWXRT and deep XRT GRB, 3XMM, XMM slew, Einstein IPC, IPC slew, WGACAT, Chandra, and BMW: Voges et al. 1999, 2000; D’Elia et al. 2013; Puccetti et al. 2011; Rosen et al. 2016; Saxton et al. 2008; Harris et al. 1993; Elvis et al. 1992; White et al. 2000; Evans et al. 2010; Panzera et al. 2003). Therefore we cross-matched the IR-radio subsample with each X-ray catalogue individually, taking into account their positional errors. For instance, a radius of 0.1 arcmin was adopted for the cross-correlations (as in Paper I), unless the positional uncertainty of a source was reported to be larger than 0.1 arcmin, as in the case of many X-ray detections in the RASS survey. In these cases, we used the 95% uncertainty radius (or ellipse major axis) of each source as maximum distance for the cross-match. Some X-ray catalogues have a very wide range of positional uncertainties, thus we separated the data by positional errors and used different cross-matching radii for these X-ray catalogues. The radii used for cross-matching the IR-radio subsample with each X-ray catalogue are reported in Table 1. We also restricted the sample by Galactic latitude | b | > 10° to avoid complications in the Galactic plane. We combined all the IR-radio-X-ray matching sources and applied an internal cross-check, keeping only single IR sources within 0.1 arcmin radius; this procedure reduced the sample to 28 376 objects.
Cross-matching radii of the X-ray catalogues.
2.2. Further selection based on broadband spectral slopes
Here we take advantage of the fact that HSP blazars show radio to X-ray SEDs that distinguish them from any other type of extragalactic sources by imposing two constraints on the spectral slopes, namely 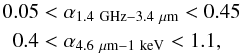 (1)where
 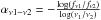 ,
,
which are the same conditions applied to the 1WHSP catalogue, with the exception that here we do not apply the criterion −1.0 <α3.4 μm−12.0 μm< 0.7. This choice was necessary to prevent the loss of IR galaxy-dominated HSPs, which could still be promising VHE candidates (see Massaro et al. 2011; Arsioli et al. 2015, for details). The parameter ranges given above are derived from the shape of the SED of HSP blazars, which is assumed to be similar to those of three well-known bright HSPs, i.e. MKN 421, MKN 501, and PKS 2155−304 shown in Fig. 3 of Paper I, which also fit within the limiting slopes (α1.4 GHz−3.4 μm and α4.6 μm−1 keV) used for the selection.
By avoiding the application of the IR slope constraints used for the 1WHSP sample, we select more HSP candidates, reducing the incompleteness at low radio luminosities where the IR flux is often dominated by the host galaxy.
2.3. Deriving νpeak and classifying the sources
The final pre-selection led to a sample of 5518 HSP-candidates, 922 of which are also 1WHSP sources. We note that this initial sample includes most of the HSP blazars that had to be added to the 1WHSP sample as additional previously known sources that were missed during the original selection procedure. To refine and further improve the quality of the sample, we used the ASDC SED builder tool2 to examine in detail all 5518 candidates, accepting only those with SEDs that are consistent with that of genuine HSPs. Finally the synchrotron component of each object that passed our screening was fitted using a third degree polynomial function to estimate parameters such as νpeak, and νpeakfνpeak, the energy flux at the synchrotron peak.
The host galaxies of HSP blazars are typically giant ellipticals, and their optical and near IR flux sometimes dominate the SED in these bands. To only fit the synchrotron component of HSP blazars, it is crucial to distinguish the non-thermal nuclear radiation from the flux coming from the host galaxy. To do so, we used the standard giant elliptical galaxy template of the ASDC SED builder tool to judge if the optical data points were due to the host galaxy or from non-thermal synchrotron radiation. If the source under examination had ultraviolet data (such as Swift-UVOT or GALEX measurements) it was straightforward to tell if there was non-thermal emission from the object.
In addition, to avoid selecting objects with misaligned jets, which are expected to be radio-extended, the accepted spatial extension of the radio counterparts (as reported in the original catalogues) was limited to 1 arcmin. This procedure was carried out whenever possible, based on the 1.4 GHz radio image from NVSS, which includes the entire sky north of δ = −40°, similarly to what had been done for the 1WHSP catalogue. We could also identify radio extended sources from their SED, since radio extended objects typically display a steep radio spectrum. All cases where we could find evidence of radio (or X-ray, typically from clusters: see below) extension were eliminated from the sample. At the end of this process, we only accepted objects with νpeak > 1015 Hz (Padovani & Giommi 1995).
Clearly, most bright sources in the current list are also included in the 1WHSP catalogue. Many of the new catalogue entries are fainter sources or objects located at low Galactic latitudes (10°< | b | < 20°). In some cases the optical data were consistent with thermal emission from the host galaxy, and the few radio, IR, or X-ray measurements that could be related to non-thermal emission were very sparse. Clearly, more multi-frequency data are needed for these sources.
We still have a number of unclear cases owing to the lack of good multi-frequency data. We flagged them accordingly. In addition, since the positional accuracy in X-ray surveys is usually not as precise as that of optical or radio surveys, the position of the X-ray counterparts sometimes may be 20 to 40 arcsec away from the radio and optical counterparts, introducing more uncertainty.
Many of the 2WHSP candidates have been observed by SWIFT with multiple short exposures. To allow for a more accurate estimation of νpeak and νpeakfνpeak, we summed all the SWIFT XRT observations that were taken within a three-week interval.
2.4. Avoiding X-ray contamination from cluster of galaxies
Blazars are certainly not the only objects that emit X-rays. For instance, galaxy clusters also show X-ray emission that is, however, normally spatially extended with a spectrum that peaks at ≈1−3 KeV resulting from the emission of giant clumps of hot and low density diffused gas (≈108 K and ≈10-3 atoms/cm3: Sarazin 1988; Böhringer & Werner 2010; Pérez-Torres et al. 2009). Since blazars and radio galaxies are often located in clusters of galaxies, the X-rays from the hot gas, if not correctly identified, might cause the SED of the candidate 2WHSP source to look like that of an HSP object, introducing a source of contamination for our sample.
To avoid this problem we carried out an extensive check of bibliographic references3 and catalogues of clusters of galaxies (e.g. ABELL, PGC, MCXC, ZW, WHL, etc.), excluding cases where cluster emission could be responsible for the observed X-rays. In addition, we used Swift XRT imaging data (which are available for ≈60% of our sample) to distinguish between X-ray emission from blazar jets, which is point-like in the XRT count maps, and that from the clusters, which is often extended. The same procedure was followed using XMM images, whenever these could be found in the public archive. In addition, we cross-matched our sample with the positions of RASS extended sources and with those of the Planck catalogue of Sunyaev-Zeldovich sources (Planck Collaboration XXXII 2015).
Finally, we visually inspected optical images and the error circle maps built with the ASDC explorer tool4 looking for targets that could be related to clusters of galaxies.
To illustrate how we removed objects that satisfy our multi-frequency selection criteria but where the X-ray flux is likely due to extended emission from a cluster of galaxies, we consider the example of WHL J151056.1+054441. This is a giant cluster of galaxies also cataloged as Abell2029. Since the strong X-ray emission is clearly extended both in the Swift-XRT and XMM images (see Fig. 1), this source was removed from our HSP catalogue.
Another example is shown in Fig. 2, where the candidate blazar is at the center of the cluster of galaxies LCRS B113851.7−115959. Although the X-ray emission is overall extended, the region around the sources shows clumps, and there are several X-ray detections; the non-thermal emission is very clear in the SED. Apparently, there is an AGN in the center that also emits in the UV. However, based on the available data, we cannot know if the X-ray is mainly from the non-thermal jet or from the cluster and, therefore, we did not include this source in the catalogue.
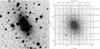 |
Fig. 1 Optical (left) and X-ray (right: XRT count map) images of WHL J151056.1+054441. |
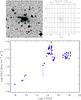 |
Fig. 2 Top: optical (left) and X-ray (right: XRT count map) images of LCRS B113851.7−115959. Bottom: SED of LCRS B113851.7−115959. |
3. Improving the sample completeness
The procedure described above led to the selection of 734 new HSPs in addition to those already included in the 1WHSP catalogue, including previously known, newly discovered, and candidate blazars. For each source, we adopted as best coordinates those taken from the WISE catalogue.
To evaluate the efficiency of our method of selecting VHE emission blazars, we cross-matched the sample of 1647 objects with the Second Catalogue of Hard Fermi-LAT Sources (2FHL, Ackermann et al. 2016) and with TeVCat.
Only 146 of the 360 sources in the 2FHL catalogue (257 at | b | > 10°) are also in this preliminary sample. To verify if there are genuine HSPs in the 2FHL catalogue that were missed by our selection, we closely examined the remaining 214 2FHL sources to see if they are cataloged as blazars. We found 31 high Galactic latitude blazars with νpeak > 1015 Hz that could be added to the catalogue. These sources were initially missed since they just did not match the optical-X-ray slope criteria (Eq. (1)) during the preliminary selection process. This selection inefficiency could be due to flux variability, lack of sufficiently high quality multi-frequency data, or simply to a non-optimal choice of parameter values in Eq. (1). Out of the 177 HSPs located at | b | > 10° in the 2FHL catalogue, our selection method detected 146 objects, for an efficiency of 82.5%.
In addition, there are 14 HSP blazars in the 2FHL catalogue that are located at latitudes | b | < 10°, the area of sky that was not considered in our work as reducing complications connected to the Galactic plane. Since our aim is to provide the most complete list of HSPs, we added the 14 low latitude objects to the 2WHSP catalogue, as well as all additional HSPs found in the 2FHL catalogue, for a total of 45 sources. Only one good HSP blazar found among the 2FHL low Galactic latitude sources had no WISE data (2WHSP J135340.2−663958.0). We used the radio position instead of the IR position in this case.
We then checked catalogues of sources detected at TeV energies. Currently, the most complete list of objects detected in this band is TeVCat, which consists of 175 sources detected by Imaging Atmospheric/Air Cherenkov Telescope/Technique (IACT). At present there are three main IACT systems operating in the ~50 GeV to 50 TeV range: the High Energy Stereoscopic System (HESS), MAGIC (Major Atmospheric Gamma Imaging Cherenkov Telescopes), and VERITAS (Very Energetic Radiation Imaging Telescope Array System). There are 38 TeVCat sources that are also in the 2WHSP catalogue. We therefore checked the other high Galactic latitude sources to see if they were classified as HSP blazars, concluding that only one HSP source was missed. We note that, previously, we had already added three TeV sources to the 1WHSP catalogue, since these were missed during its selection. In total there are 39 HSPs at | b | > 10° in TeVCat, 35 of which satisfy our selection criteria. Our selection efficiency in this case is 89.7%.
As in the case of the 2FHL catalogue, all missing sources have been lost because they just did not meet the slope criteria used in Sect. 2.2. In all cases, however, the spectral parameters turned out to be very close to the limits of the selection criteria, and νpeak was ≈1015 Hz.
The final 2WHSP catalogue includes a total of 1691 sources, 288 of which are newly identified HSPs, 540 are previously known HSPs, 814 are HSP candidates, 45 are HSP blazars taken from the 2FHL catalogue, and four from TeVcat. The complete list of 2WHSP sources is shown in Table 4.
We will further discuss the incompleteness owing to the inefficiency in finding sources peaking at or just above 1015 Hz in Sect. 4.1.
4. Discussion
4.1. The νpeak distribution
The νpeak distribution of the 2WHSP sources is shown in Fig. 3. The peak of the distribution is located at ≈1015.5 Hz and not at the threshold of νpeak= 1015 Hz used for the sample selection. This is very likely due to incompleteness of the sample near the νpeak threshold, as our selection criteria were tuned to avoid too large an LSP contamination. The distribution is similar to that of the 1WHSP sample and of the subsample of HSP sources in the 5BZCat
When compared with other catalogues of extreme blazars, the peak value of the νpeak distribution of our sample is lower. For example the Sedentary and the Kapanadze (2013, hereafter K13) catalogues have peak values ≈1016.8 and ≈1016.7 Hz, respectively. This difference results from the criteria used and the different selected methods. The Sedentary and Kapanadze (2013) catalogues, for example, were tuned to select sources with very large νpeak values. We note that the νpeak of some sources is particularly high, with values ≳1018 Hz. We discuss these extreme sources in the next section.
Sometimes, the severe variability of HSPs may result in displacements for νpeak in different phases, such as MRK501 (see Fig. 8); not to mention that the intense variability will make the νpeakfνpeak vary by an order of 1–2 or even worse. In these cases, we fit the νpeak and νpeakfνpeak with the mean values to estimate the proper values for the synchrotron component averagely. By doing so, we avoid having extreme values for the synchrotron peak and reduce the effects of variability.
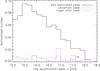 |
Fig. 3 νpeak distribution. The black solid line, blue dotted line, and red dashed line denote well-estimated νpeak, uncertain νpeak, and lower limits on νpeak, respectively. |
Extreme synchrotron peaked sources.
4.2. The highest νpeak blazars
There are several sources in the 2WHSP sample with νpeak around or above 1018 Hz; these are usually called extreme blazars. Values of νpeak ≳ 1018 Hz imply that the electrons responsible for the synchrotron radiation must be accelerated to extremely high energies (see the Introduction and, for example, Rybicki & Lightman 1986; Costamante et al. 2001).
It is hard to estimate the positions of the synchrotron peak for such extreme sources, since the available data in the X-ray band is often limited to a few keV, where most of the sensitive existing detectors operate. For about 20 sources we could not estimate the frequency of the synchrotron peak accurately since the soft X-ray data show a still rising spectrum in the SED, and no hard X-ray data exist to cover the peak of the emission. In these cases, we could only estimate a lower limit to νpeak. For some strong X-ray variable sources with many X-ray observations we also could not obtain well-estimated νpeakvalues with the third degree polynomial fitting in ASDC SED tool since the curvature in the X-ray spectrum (and with it νpeak) changes with time. However, in all these cases, the available multi-frequency data imply that the synchrotron peak is within the X-ray band; in these sources we estimated an average νpeakvalue using a second-degree polynomial in the X-ray band.
Table 2 gives the list of all the extreme sources with νpeak≥ 1017.9 Hz or sources with lower limit νpeak; this includes many more such objects than any previous catalogue. These extreme sources are particularly importance since they may be candidate VHE, neutrino, or ultra high energy cosmic ray (UHECR) sources (Sects. 4.6 and 4.7). Figures 4 to 8 illustrate five examples of SEDs of representative objects from Table 2.
-
2WHSP J023248.5+201717 (1ES0229+200). This is anextreme source with VHE data available (the ebl-deabsorbedVHE data (shown as dark blue filled circles) are from Finke et al. 2015).The synchrotron peak is at ~1018−1019 Hz and the peak frequency is one of the highest among the 2WHSP sources. In the VHE band, with the VHE fluxes for EBL absorption corrected, the inverse Compton peak will be at energies >1 TeV.
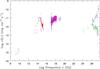
Fig. 4 SED of the extreme object 2WHSP J023248.5+201717. The dark blue points are ebl- deabsorbed data from Finke et al. (2015). See text for details.
-
2WHSP J035257.4−683117. This is a known blazar with log νpeak≈ 18.1. It has hard X-ray and γ-ray detections, but no TeV detection yet. This source might be a good target for next generation TeV telescopes. This source is not in 5BZCat yet.
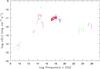
Fig. 5 SEDs of the extreme object 2WHSP J035257.4−683117. See text for details.
-
2WHSP J215305.2−004229 (5BZBJ2153−0042). This source has a very hard X-ray spectrum and the SED in the X-ray band keeps increasing up to the highest energies, implying a νpeak larger that 1018 Hz. The X-ray emission is not likely to be related to a cluster of galaxys since it is compact. It has γ-ray data and may be a good TeV candidate source.
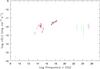
Fig. 6 SED of the extreme object 2WHSP J215305.2−004229. See text for details.
-
2WHSP J143342.7−730437. This is another example of a very hard X-ray SED. This has UV data but so far did not have any γ-ray data; however, this source is in the list of new γ-ray detections in Arsioli & Chang (2016).
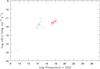
Fig. 7 SEDs of the extreme object 2WHSP J143342.7−730437. See text for details.
-
2WHSP J165352.2+394536. This is the well-known HSP MRK501. On average log νpeak ~ 17.9 Hz; however, during an X-ray flare, as shown by the BeppoSAX data (yellow points in the SED, Giommi et al. 2002), νpeak reached >1018 Hz. We note that in Pian et al. (1998), they discussed the BeppoSAX observation of MRK501 in April 1997 and showed that the νpeak of that shift at least two orders of magnitude with regard to previous observations. The was the first time this scenario had been seen.
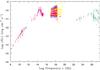
Fig. 8 SEDs of the extreme object 2WHSP J165352.2+394536. See text for details.
4.3. The redshift distribution
Some 2WHSP sources lack redshift since their optical spectra are completely featureless. As in Paper I, we estimated lower limit redshifts for these sources. Assuming that in the optical band the host galaxy is swamped by the non-thermal emissions and leaves no imprint on the optical spectrum when the observed non-thermal flux is at least ten times larger than the host galaxy flux, we used the distance modulus (for details, see Eq. (5) in Paper I) to calculate the lower limits redshifts. For the others, we obtained the redshifts from the references listed in Table 4.
Figure 9 shows the redshift distribution, which peaks just above 0.2. For all 2WHSP sources, ⟨ zall ⟩ = 0.371 ± 0.005; for firm redshift 2WHSP sources, ⟨ z ⟩ = 0.331 ± 0.008. Clearly, sources without firm redshift are, on average, farther away than sources with firm redshift. High redshift sources in flux limited samples tend to have featureless optical spectra as the host galaxy contribution is overwhelmed by the synchrotron emission. Giommi et al. (2012) have predicted that the redshift distribution of BL Lacs without redshift in radio flux limited surveys will peak around zpredict ≈ 1.2. The results again suggest that all source with only lower limit redshift, or without redshift, could be much further away than objects with measured redshift.
Considering only sources with firm z values, the redshift distribution of 2WHSP sources is similar but not identical to other HSP catalogues/subsamples. The average redshift of the 1WHSP catalogue is ⟨ z1whsp ⟩ = 0.306, that of the subsample of HSPs (νpeak > 1015 Hz) in 5BZCat is ⟨ zbzcat ⟩ = 0.294, that of the Sedentary sources is ⟨ zs ⟩ = 0.320, and that of the K13 catalogue is ⟨ zk ⟩ = 0.289. For instance in K13, the redshifts range is 0.031 <zk< 0.702 while, in this paper, we selected a number of sources with relatively high redshift (z> 0.7) that are not in previous catalogues.
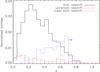 |
Fig. 9 Redshift distribution of 2WHSP sources. The black solid line represents the sources with firm redshifts, the red dashed line the sources with uncertain redshift, and the blue dotted line the lower limits. |
4.4. The radio log N–log S of HSP blazars
The estimation of the statistical properties, such as the log N−log S of a population of sources, requires the availability of flux-limited and complete samples. Since we demand that all 2WHSP sources have a radio, IR, and X-ray counterpart, we must take into account the incompleteness resulting from the fact that the only existing all sky X-ray survey is not sufficiently deep to ensure the detection of all radio and IR faint HSP blazars.
To estimate the log N−log S, we then considered the subsample of 2WHSP sources that are included in the RASS X-ray survey, which covers the entire sky, albeit with sensitivity that strongly depends on ecliptic latitude (see Sect. 4.3 of Paper I for more details).
For each source in the 2WHSP-RASS subsample, we therefore calculated a contribution ni to the total density, as given by ni = 1 /Ai deg-2, where the parameter Ai is the sky area covered by RASS with sensitivity sufficient to detect the source in consideration. We then sum the contribution of all sources in a given flux bin Nbin = ∑ ni and obtain the log N−log S. We use this approach to estimate the log N−log S of HSP blazars with respect to the radio flux density.
The integral radio log N−log S for the 2WHSP sample is shown in Fig. 10, where we also plot the log N−log S for the Sedentary HBL (Giommi et al. 1999, 2005; Piranomonte et al. 2007) for comparison. The dotted lines correspond to a fixed slope of –1.5, the expected value for a complete sample of a non-evolving population in a Euclidean Universe. Since the radio surveys that we use have different sensitivities in the northern and southern sky, we only considered sources with δ> −40° and radio flux density ≥5 mJy.
It is clear from Fig. 10 that the surface density of the 2WHSP sample is approximately a factor of ten larger than that of the Sedentary Survey, which is expected since the latter includes more extreme sources (its νpeak distribution peaks at log νpeak ~ 16.8, as compared to log νpeak ~ 15.5 for the 2WHSP sample). Apart from the different normalizations, the log N−log S of the two samples show similar trends deviating from the Euclidean slope at radio flux densities lower than ≈20 mJy. The 2WHSP flattening, however, appears to be stronger than that of the Sedentary Survey, which suggests the onset of some degree of incompleteness at lower radio flux densities, on top of the evolutionary effects discussed by Giommi et al. (1999). The 2WHSP maximum surface density corresponds to a total of ~1900 HSP blazars over the whole sky. Given that this number refers only to sources with 1.4 GHz flux density ≥5 mJy, and because of the incompleteness discussed above, this has to be considered a robust lower limit.
Figure 10 shows also the 5 GHz5 number counts for the Deep X-ray Radio Blazar Survey (DXRBS) BL Lacs (red squares) and HBL only (red diamonds) from Padovani et al. (2007). The latter are in very good agreement with the 2WHSP number counts in the region of overlap, which shows that our selection criteria are robust. Moreover, a clear trend can be seen going from the Sedentary Survey to the 2WHSP sample and to the whole BL Lac population, with an increase in number by a factor ≈10 at every step. Given the unbiased nature of radio selection with respect to νpeak, this is a direct consequence of BL Lac demographics, with HBL making up only ~10% of the total (see also, for example, Padovani et al. 2007).
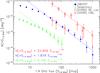 |
Fig. 10 Integral radio log N−log S at 1.4 GHz. The blue filled circles denote the 2WHSP catalogue, the green open triangles indicate the Sedentary survey, the red open squares represent DXRBS BL Lacs of all types, while the red diamonds are the subsample of HBLs in the DXRBS (those in the HBL box: see Padovani et al. 2007, for details). The dashed lines have a slope of −1.5. |
4.5. The IR colour–colour plot
Figure 11 shows the WISE IR colour–colour diagram of 2WHSP sources, with signal to noise ratio (S/N) in the W3 channel larger than 2, and the sources in the first WHSP sample and HSP blazars in the 5BZCat list. As expected, all of the 1WHSP sources are within the SWCD region since this was one of the criteria of the selection. By dropping the IR slope criterion (−1.0 <α3.4 μm−12.0 μm< 0.7) the 2WHSP sample includes more HSPs that are located in the bottom-left region within the SWCD than the 1WHSP sample.
There are also 47 sources outside the SWCD region (see Table 3), five of which are also in 5BZCat. The sources at the bottom are dominated by the host galaxy in the optical and near IR bands (Class 1). The right part of Fig. 11 is occupied by sources with problematic W3 photometry and sources whose W3 magnitude has relatively small S/N values (typically <4: Class 2). The sources located in the upper-right region have W1 fluxes similar or slightly lower than the W2 fluxes (Class 3). The class 3 sources may be IR variable sources or could be blazars at the border between ISP and HSP objects or might simply have poor W1 or W2 photometry. All 47 sources were checked individually and all of them are good HSP candidates. Thus, we suggest that the SWCD region needs to be extended to include all galaxy-dominated HSPs.
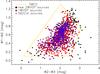 |
Fig. 11 IR colour–colour diagram. The black points are the sources we selected in 2WHSP but not in 1WHSP, the red points are the selected in 1WHSP, the blue crosses are the sources also in 5BZCat. The yellow line marks the SWCD region. |
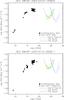 |
Fig. 12 VHE observations candidates. Top: 2WHSP J083724.6+145820; bottom: 2WHSP J225147.5−320611. The red line and blue lines are the Fermi Pass 8 and CTA sensitivities, respectively. The green circles are the data from Fermi Pass 8, and the black points are the data from other wavebands. The Pass 8 data are obtained from the Fermi tool using the 2WHSP position. These sources are not yet in the 3FGL catalogue (see Arsioli & Chang 2016). |
Sources outside the SWCD region.
4.6. Candidates for GeV and VHE γ-ray observations
Since HSPs are the dominant population in the extragalactic VHE sky, the 2WHSP catalogue provides good candidates for the search of sources in Fermi catalogues and in the VHE band. The Figure of Merit (FOM, defined in Arsioli et al. 2015, as the ratio between the synchrotron peak flux νpeakfνpeak of a given source and that of the faintest blazar in the 1WHSP sample that has already been detected in the TeV band) was introduced to provide a simple quantitative measure of potential detectability of HSPs by TeV instruments. The FOM parameter is reported for all 2WHSP sources and gives an objective way to assess the likelihood that a given HSP may be detectable as a TeV source. As discussed in Paper I, relatively high FOM sources (FOM > 0.1) are good targets for observation with the upcoming Cherenkov Telescope Array (CTA). Another upcoming instrument, the Large High Altitude Air Shower Observatory (LHAASO), is currently designed to survey with unprecedented sensitivity the whole northern sky for γ-ray sources above 300 GeV. Therefore, high FOM 2WHSP sources may also provide seed-positions for searches of γ-ray signature embedded in LHAASO data (Cao et al. 2010).
For example, 2WHSP J083724.6+145820 (see Fig. 12), has νpeak ~ 1016.7 Hz and νpeakfνpeak~ 10-11 erg cm-2 s-1 (or FOM = 2), but it had no γ-ray counterpart until recently. The green points in Fig. 12 correspond to the new γ-ray data presented in Arsioli & Chang (2016). Another example is 2WHSP J225147.5−320611, which has νpeak > 1018 Hz and νpeakfνpeak > 10-11.3 erg cm-2 s-1 (FOM > 1), but also had no γ-ray counterpart in current available γ-ray or VHE catalogues (1/2/3 FGL, 1/2 FHL, and TeVCat) until it was detected by Arsioli & Chang (2016) thanks to the 2WHSP, which points to promising x-ray targets.
To better assess the percentage of detection of HSP blazars in the γ-ray band, in fact, Arsioli & Chang (2016) have recently performed a dedicated γ-ray analysis of all 2WHSP sources with FOM ≥ 0.16, using archival Fermi-LAT observations integrated over 7.2 yr of observations. By using the position of 2WHSP sources as seeds for the data analysis, ≈85 sources were identified at the >5σ (TS > 25) level, and another 65 at a less significant (10 < TS < 25) level. These results demonstrate the potential of HSP catalogues for the detection and identification of γ-ray and VHE sources.
Apart from that, the CTA flux limit/sensitivity could be as low as 3 × 10-13 erg cm-2 s-1 (Rieger et al. 2013) or ~1 mCrab at 1 TeV for 50-h exposure. Clearly, from Fig. 12, 2WHSP J083724.6+145820 and 2WHSP J225147.5−320611 may be detected by CTA in the future (since they are above the CTA sensitivity for an exposure time of 50 h, the blue lines). Therefore, with the benefit of multi-wavelength work, we provide many candidates for future VHE observations.
4.7. HSP blazars as neutrino and cosmic ray emitters?
Blazars have been considered as likely neutrino sources for quite some time (e.g. Mannheim 1995). Padovani & Resconi (2014) have suggested that blazars of the HSP type, where particles are accelerated to the highest energies, may be good candidates for neutrino emission and presented evidence for an association between HSP blazars and neutrinos detected by the IceCube South Pole Neutrino Observatory6.
Petropoulou et al. (2015) further modelled the HE SED of six HSPs selected by Padovani & Resconi (2014) as most probable neutrino sources and predicted their neutrino fluxes. All six predicted fluxes were consistent, within the errors, with the observed neutrino fluxes from IceCube, especially for two sources (MKN421 and H1914−194).
Padovani et al. (2016) have recently cross-matched two VHE catalogues and the 2WHSP with the most recent IceCube neutrino lists (IceCube Collaboration 2015), measuring the number of neutrino events with at least one γ-ray counterpart. In all three catalogues they observed a positive fluctuation with respect to the mean random expectation at a significance level between 0.4 and 1.3%, with a p-value of 0.7% for 2WHSP sources with FOM ≳ 1. All HBLs considered to be the most probable counterparts of IceCube neutrinos are 2WHSP sources, which strongly suggests that strong, VHE γ-ray HBLs are so far the most promising blazar counterparts of astrophysical neutrinos.
Finally, Resconi et al. (2016) have presented evidence of a direct connection between HSP, VHE neutrinos, and ultra high energy cosmic rays (UHECRs) by correlating the same catalogues used by Padovani et al. (2016) with UHECRs from the Pierre Auger Observatory and the Telescope Array. A maximal excess of 80 cosmic rays (41.9 expected) was observed for 2FHL HBL. The chance probability for this to happen is 1.6 × 10⁻⁵, which translates to 5.5 × 10⁻⁴ (3.26σ) after compensation for trials.
5. Conclusions
We have assembled the 2WHSP catalogue, currently the largest and most complete existing catalogue of HSP blazars, by using a multi-frequency method and a detailed comparison with existing lists of γ-ray emitting blazars. 2WHSP extends the previous 1WHSP catalogue (Arsioli et al. 2015) down to lower Galactic latitudes (| b | > 10°) and to fainter IR fluxes. In addition, it includes all the bright known HSP blazars close to the Galactic plane. The 2WHSP sample includes 1691 confirmed or candidates HSP blazars and was also put together to provide a large list of potential targets for VHE and multi-messenger observations.
The average νpeak for our catalogue is ⟨ log νpeak ⟩ = 16.22 ± 0.02 Hz and the average redshift is ⟨ z ⟩ = 0.331 ± 0.008. We have shown that the SWCD region needs to be extended to include HSPs in which the host galaxy is dominant.
Our radio log N−log S shows that the number of HSP blazars over the whole sky is >2000 and that HBL make up ~10% of all BL Lacs.
Finally, we note that this catalogue has already been used to provide seeds for the identification of new Fermi-LAT objects and to look for astrophysical counterparts to neutrino and UHECR sources (Padovani et al. 2016; Resconi et al. 2016), which proves the relevance of having a large HSP catalogue for multi-messenger astronomy.
For the cross-check with ADS references on each source we have used the Bibliographic Tool available on the ASDC website.
Given that BL Lacs typically have flat radio spectra, we did not convert the 5 GHz counts to 1.4 GHz.
Acknowledgments
Y.L.C. is supported by the Government of the Republic of China (Taiwan), B.A. is supported by the Brazilian Scientific Program Ciências sem Fronteiras – Cnpq. This work was supported by the Agenzia Spaziale Italiana Science Data Center (ASDC) and the University La Sapienza of Rome, Department of Physics. P.P. thanks the ASDC for the hospitality and partial financial support for his visits. We made use of archival data and bibliographic information obtained from the NASA/IPAC Extragalactic Database (NED), data and software facilities from the ASDC managed by the Italian Space Agency (ASI). Extensive use was made of the TOPCAT software package (http://www.star.bris.ac.uk/~mbt/topcat/).
References
- Abdo, A., Ackermann, M., Agudo, I., et al. 2010, ApJ, 716, 30 [NASA ADS] [CrossRef] [Google Scholar]
- Ackermann, M., Ajello, M., Atwood, W. B., et al. 2016, ApJS, 222, 5 [NASA ADS] [CrossRef] [Google Scholar]
- Ajello, M., Gasparrini, D., Sanchez-Conde, M., et al. 2015, ApJ, 800, L27 [NASA ADS] [CrossRef] [Google Scholar]
- Antonucci, R. 1993, ARA&A, 31, 473 [Google Scholar]
- Arsioli, B., & Chang, Y.-L. 2016, A&A, in press, DOI: 10.1051/0004-6361/201628691 [Google Scholar]
- Arsioli, B., Fraga, B., Giommi, P., Padovani, P., & Marrese, P. M. 2015, A&A, 579, A34 [NASA ADS] [CrossRef] [EDP Sciences] [Google Scholar]
- Blandford, R., & Rees, M. 1978, in Pittsburgh Conf. BL Lac Objects, ed. A. M. Wolfe (Pittsburgh: University of Pittsburgh press), 341 [Google Scholar]
- Böhringer, H., & Werner, N. 2010, A&ARv, 18, 127 [NASA ADS] [CrossRef] [Google Scholar]
- Bonnoli, G., Tavecchio, F., Ghisellini, G., & Sbarrato, T. 2015, MNRAS, 451, 611 [NASA ADS] [CrossRef] [Google Scholar]
- Cao, Z., Bi, X. J., Cao, Z., et al. 2010, in 38th COSPAR Sci. Assem., Bremen, 2 [Google Scholar]
- Condon, J., Cotton, W., Greisen, E., et al. 1998, AJ, 115, 1693 [NASA ADS] [CrossRef] [Google Scholar]
- Costamante, L., Ghisellini, G., Giommi, P., et al. 2001, A&A, 371, 512 [NASA ADS] [CrossRef] [EDP Sciences] [Google Scholar]
- Cutri, R. M., Wright, E. L., Conrow, T., et al. 2013, Explanatory Supplement to the AllWISE Data Release Products, Tech. rep. [Google Scholar]
- D’Abrusco, R., Massaro, F., Ajello, M., et al. 2012, ApJ, 748, 68 [NASA ADS] [CrossRef] [Google Scholar]
- D’Elia, V., Perri, M., Puccetti, S., et al. 2013, A&A, 551, A142 [NASA ADS] [CrossRef] [EDP Sciences] [Google Scholar]
- Dermer, C. D., Cavadini, M., Razzaque, S., et al. 2011, ApJ, 733, L21 [NASA ADS] [CrossRef] [Google Scholar]
- Di Mauro, M., Donato, F., Lamanna, G., Sanchez, D. A., & Serpico, P. D. 2014, ApJ, 786, 129 [NASA ADS] [CrossRef] [Google Scholar]
- Elvis, M., Plummer, D., Schachter, J., & Fabbiano, G. 1992, ApJS, 80, 257 [NASA ADS] [CrossRef] [Google Scholar]
- Evans, I. N., Primini, F. A., Glotfelty, K. J., et al. 2010, ApJS, 189, 37 [NASA ADS] [CrossRef] [EDP Sciences] [Google Scholar]
- Finke, J. D., Reyes, L. C., Georganopoulos, M., et al. 2015, ApJ, 814, 20 [NASA ADS] [CrossRef] [Google Scholar]
- Giommi, P., & Padovani, P. 2015, MNRAS, 450, 2404 [NASA ADS] [CrossRef] [Google Scholar]
- Giommi, P., Menna, M. T., & Padovani, P. 1999, MNRAS, 310, 465 [NASA ADS] [CrossRef] [Google Scholar]
- Giommi, P., Capalbi, M., Fiocchi, M., et al. 2002, in Blazar Astrophysics with BeppoSAX and Other Observatories, eds. P. Giommi, E. Massaro, & G. Palumbo, 63 [Google Scholar]
- Giommi, P., Piranomonte, S., Perri, M., & Padovani, P. 2005, A&A, 434, 385 [NASA ADS] [CrossRef] [EDP Sciences] [Google Scholar]
- Giommi, P., Colafrancesco, S., Cavazzuti, E., Perri, M., & Pittori, C. 2006, A&A, 445, 843 [NASA ADS] [CrossRef] [EDP Sciences] [Google Scholar]
- Giommi, P., Colafrancesco, S., Padovani, P., et al. 2009, A&A, 508, 107 [NASA ADS] [CrossRef] [EDP Sciences] [Google Scholar]
- Giommi, P., Padovani, P., Polenta, G., et al. 2012, MNRAS, 420, 2899 [NASA ADS] [CrossRef] [Google Scholar]
- Harris, D. E., Forman, W., Gioia, I. M., et al. 1993, The Einstein Observatory catalogue of IPC X ray sources, Volume 1E: Documentation [Google Scholar]
- IceCube Collaboration 2015, in 34th Int. Cosm. Ray Conf. [Google Scholar]
- Kapanadze, B. 2013, AJ, 145, 31 [NASA ADS] [CrossRef] [Google Scholar]
- Manch, T., Murphy, T., Buttery, H. J., et al. 2003, MNRAS, 342, 1117 [NASA ADS] [CrossRef] [Google Scholar]
- Mannheim, K. 1995, Astropart. Phys., 3, 295 [NASA ADS] [CrossRef] [Google Scholar]
- Massaro, E., Giommi, P., Leto, C., et al. 2009, A&A, 495, 691 [NASA ADS] [CrossRef] [EDP Sciences] [Google Scholar]
- Massaro, F., D’Abrusco, R., Ajello, M., Grindlay, J., & Smith, H. 2011, ApJ, 740, L48 [NASA ADS] [CrossRef] [Google Scholar]
- Massaro, E., Nesci, R., & Piranomonte, S. 2012, MNRAS, 422, 2322 [NASA ADS] [CrossRef] [Google Scholar]
- Massaro, E., Maselli, A., Leto, C., et al. 2015, Ap&SS, 357, 75 [NASA ADS] [CrossRef] [Google Scholar]
- Padovani, P., & Giommi, P. 1995, ApJ, 444, 567 [NASA ADS] [CrossRef] [Google Scholar]
- Padovani, P., & Giommi, P. 2015, MNRAS, 446, L41 [NASA ADS] [CrossRef] [Google Scholar]
- Padovani, P., & Resconi, E. 2014, MNRAS, 443, 474 [NASA ADS] [CrossRef] [Google Scholar]
- Padovani, P., Ghisellini, G., Fabian, A. C., & Celotti, A. 1993, MNRAS, 260, L21 [NASA ADS] [CrossRef] [Google Scholar]
- Padovani, P., Giommi, P., Landt, H., & Perlman, E. S. 2007, ApJ, 662, 182 [NASA ADS] [CrossRef] [Google Scholar]
- Padovani, P., Resconi, E., Giommi, P., Arsioli, B., & Chang, Y. L. 2016, MNRAS, 457, 3582 [NASA ADS] [CrossRef] [Google Scholar]
- Panzera, M. R., Campana, S., Covino, S., et al. 2003, A&A, 399, 351 [NASA ADS] [CrossRef] [EDP Sciences] [Google Scholar]
- Pérez-Torres, M. A., Zandanel, F., Guerrero, M. A., et al. 2009, MNRAS, 396, 2237 [NASA ADS] [CrossRef] [Google Scholar]
- Petropoulou, M., Dimitrakoudis, S., Padovani, P., Mastichiadis, A., & Resconi, E. 2015, MNRAS, 448, 2412 [NASA ADS] [CrossRef] [Google Scholar]
- Pfrommer, C., Broderick, A. E., Chang, P., Puchwein, E., & Springel, V. 2013, ArXiv e-prints [arXiv:1308.6284] [Google Scholar]
- Pian, E., Vacanti, G., Tagliaferri, G., et al. 1998, ApJ, 492, L17 [NASA ADS] [CrossRef] [Google Scholar]
- Piranomonte, S., Perri, M., Giommi, P., Landt, H., & Padovani, P. 2007, A&A, 470, 787 [NASA ADS] [CrossRef] [EDP Sciences] [Google Scholar]
- Planck Collaboration XXXII. 2015, A&A, 581, A14 [NASA ADS] [CrossRef] [EDP Sciences] [Google Scholar]
- Puccetti, S., Capalbi, M., Giommi, P., et al. 2011, A&A, 528, A122 [NASA ADS] [CrossRef] [EDP Sciences] [Google Scholar]
- Resconi, E., Coenders, S., Padovani, P., Giommi, P., & Caccianiga, L. 2016, Phys. Rev. Lett., submitted [Google Scholar]
- Rieger, F. M., de Oña-Wilhelmi, E., & Aharonian, F. A. 2013, Front. Phys., 8, 714 [Google Scholar]
- Rosen, S. R., Webb, N. A., Watson, M. G., et al. 2016, A&A, 590, A1 [NASA ADS] [CrossRef] [EDP Sciences] [Google Scholar]
- Rybicki, G. B., & Lightman, A. P. 1986, Radiative Processes in Astrophysics (Wiley-VCH), 400 [Google Scholar]
- Sarazin, C. L. 1988, X-ray emission from clusters of galaxies (Cambridge: Cambridge Astrophysics Series) [Google Scholar]
- Saxton, R. D., Read, A. M., Esquej, P., et al. 2008, A&A, 480, 611 [NASA ADS] [CrossRef] [EDP Sciences] [Google Scholar]
- Schachter, J. F., Stocke, J. T., Perlman, E., et al. 1993, ApJ, 412, 541 [NASA ADS] [CrossRef] [Google Scholar]
- Stocke, J. T., Morris, S. L., Gioia, I. M., et al. 1991, ApJS, 76, 813 [NASA ADS] [CrossRef] [Google Scholar]
- Urry, C. M., & Padovani, P. 1995, PASP, 107, 803 [NASA ADS] [CrossRef] [Google Scholar]
- Voges, W., Aschenbach, B., Boller, T., et al. 1999, A&A, 349, 389 [NASA ADS] [Google Scholar]
- Voges, W., Aschenbach, B., Boller, T., et al. 2000, in IAU Circ, 7432, #1 [Google Scholar]
- White, N., Giommi, P., & Angelini, L. 2000, VizieR Online Data Catalog: IX/31 [Google Scholar]
- White, R. L., Becker, R. H., Helfand, D. J., & Gregg, M. D. 1997, ApJ, 475, 479 [NASA ADS] [CrossRef] [Google Scholar]
All Tables
All Figures
|
Fig. 1 Optical (left) and X-ray (right: XRT count map) images of WHL J151056.1+054441. |
| In the text | |
|
Fig. 2 Top: optical (left) and X-ray (right: XRT count map) images of LCRS B113851.7−115959. Bottom: SED of LCRS B113851.7−115959. |
| In the text | |
|
Fig. 3 νpeak distribution. The black solid line, blue dotted line, and red dashed line denote well-estimated νpeak, uncertain νpeak, and lower limits on νpeak, respectively. |
| In the text | |
|
Fig. 4 SED of the extreme object 2WHSP J023248.5+201717. The dark blue points are ebl- deabsorbed data from Finke et al. (2015). See text for details. |
| In the text | |
|
Fig. 5 SEDs of the extreme object 2WHSP J035257.4−683117. See text for details. |
| In the text | |
|
Fig. 6 SED of the extreme object 2WHSP J215305.2−004229. See text for details. |
| In the text | |
|
Fig. 7 SEDs of the extreme object 2WHSP J143342.7−730437. See text for details. |
| In the text | |
|
Fig. 8 SEDs of the extreme object 2WHSP J165352.2+394536. See text for details. |
| In the text | |
|
Fig. 9 Redshift distribution of 2WHSP sources. The black solid line represents the sources with firm redshifts, the red dashed line the sources with uncertain redshift, and the blue dotted line the lower limits. |
| In the text | |
|
Fig. 10 Integral radio log N−log S at 1.4 GHz. The blue filled circles denote the 2WHSP catalogue, the green open triangles indicate the Sedentary survey, the red open squares represent DXRBS BL Lacs of all types, while the red diamonds are the subsample of HBLs in the DXRBS (those in the HBL box: see Padovani et al. 2007, for details). The dashed lines have a slope of −1.5. |
| In the text | |
|
Fig. 11 IR colour–colour diagram. The black points are the sources we selected in 2WHSP but not in 1WHSP, the red points are the selected in 1WHSP, the blue crosses are the sources also in 5BZCat. The yellow line marks the SWCD region. |
| In the text | |
|
Fig. 12 VHE observations candidates. Top: 2WHSP J083724.6+145820; bottom: 2WHSP J225147.5−320611. The red line and blue lines are the Fermi Pass 8 and CTA sensitivities, respectively. The green circles are the data from Fermi Pass 8, and the black points are the data from other wavebands. The Pass 8 data are obtained from the Fermi tool using the 2WHSP position. These sources are not yet in the 3FGL catalogue (see Arsioli & Chang 2016). |
| In the text | |
Current usage metrics show cumulative count of Article Views (full-text article views including HTML views, PDF and ePub downloads, according to the available data) and Abstracts Views on Vision4Press platform.
Data correspond to usage on the plateform after 2015. The current usage metrics is available 48-96 hours after online publication and is updated daily on week days.
Initial download of the metrics may take a while.