Fig. 12
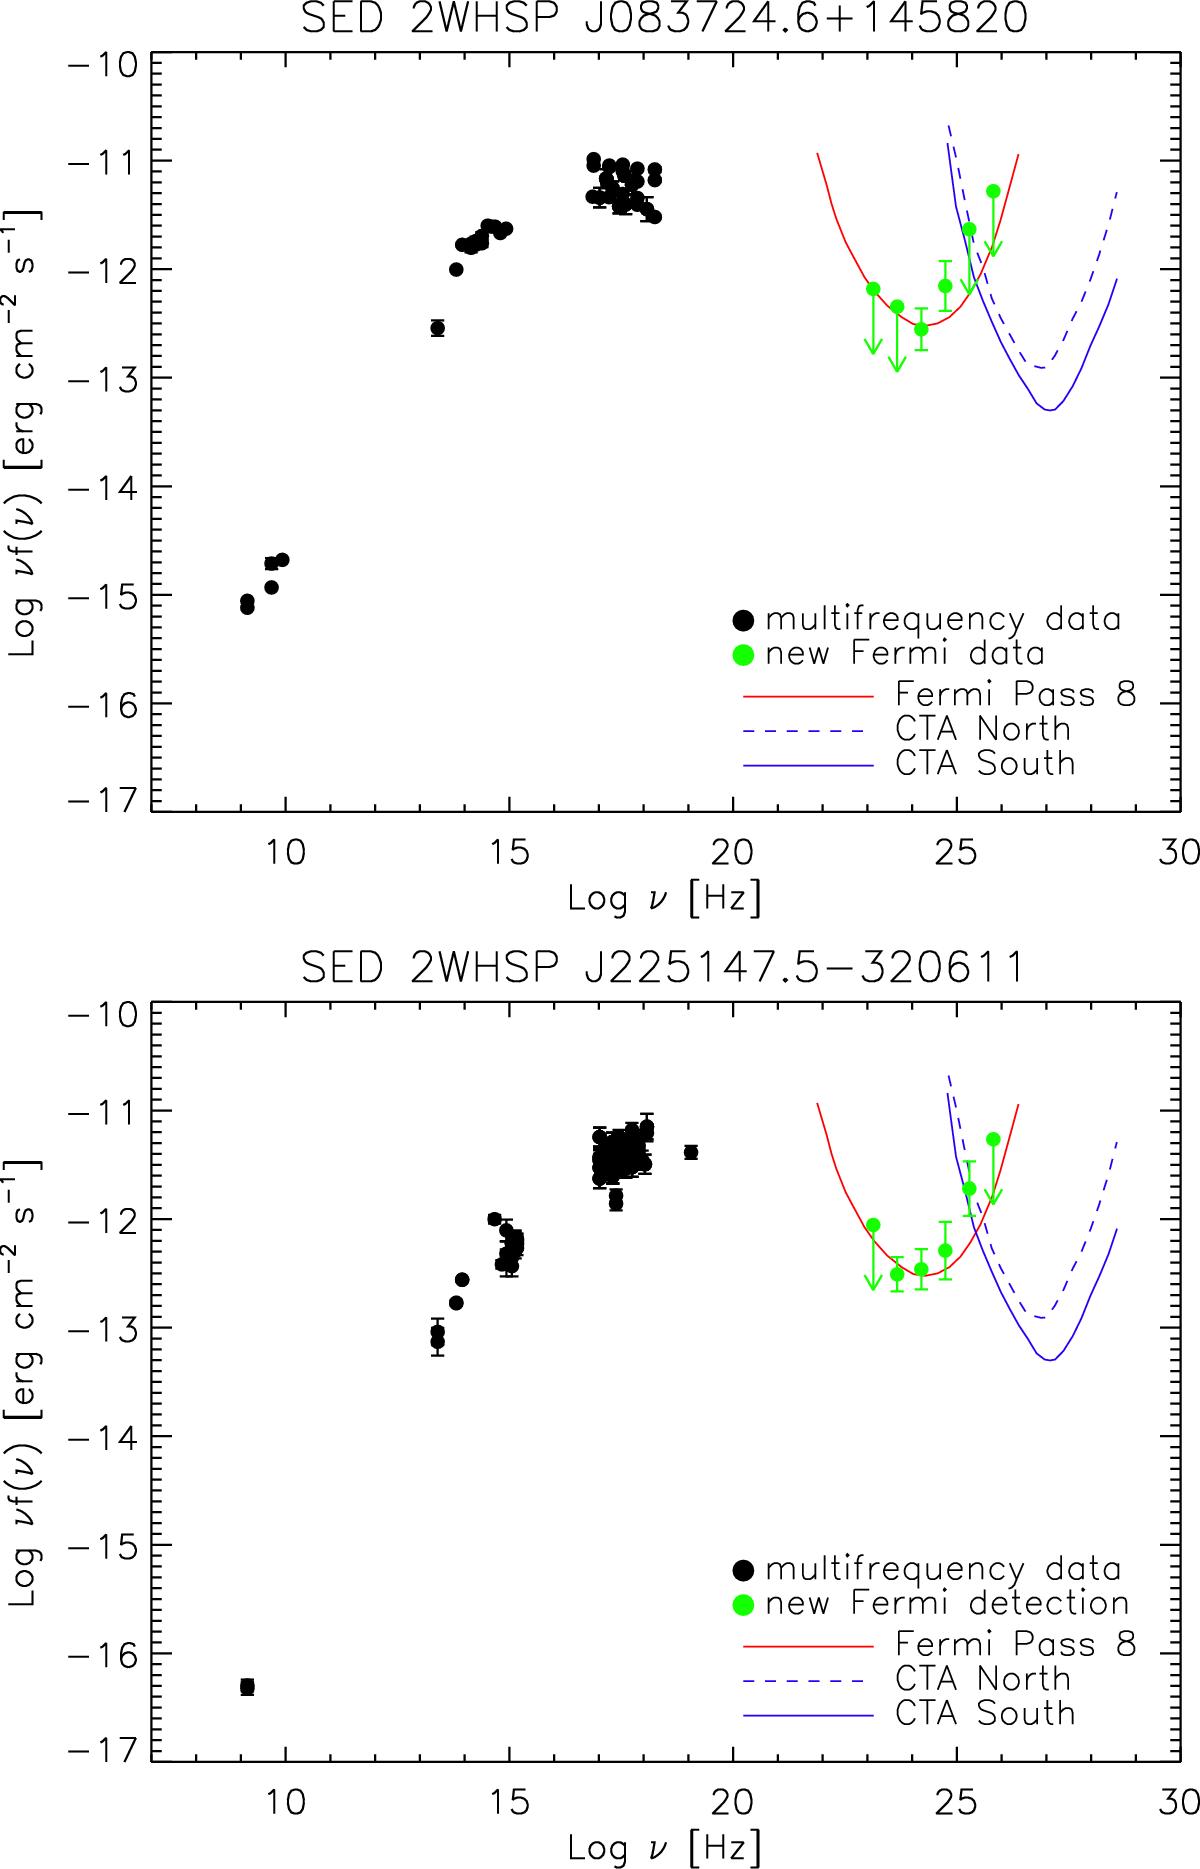
VHE observations candidates. Top: 2WHSP J083724.6+145820; bottom: 2WHSP J225147.5−320611. The red line and blue lines are the Fermi Pass 8 and CTA sensitivities, respectively. The green circles are the data from Fermi Pass 8, and the black points are the data from other wavebands. The Pass 8 data are obtained from the Fermi tool using the 2WHSP position. These sources are not yet in the 3FGL catalogue (see Arsioli & Chang 2016).
Current usage metrics show cumulative count of Article Views (full-text article views including HTML views, PDF and ePub downloads, according to the available data) and Abstracts Views on Vision4Press platform.
Data correspond to usage on the plateform after 2015. The current usage metrics is available 48-96 hours after online publication and is updated daily on week days.
Initial download of the metrics may take a while.