Free Access
Fig. 11
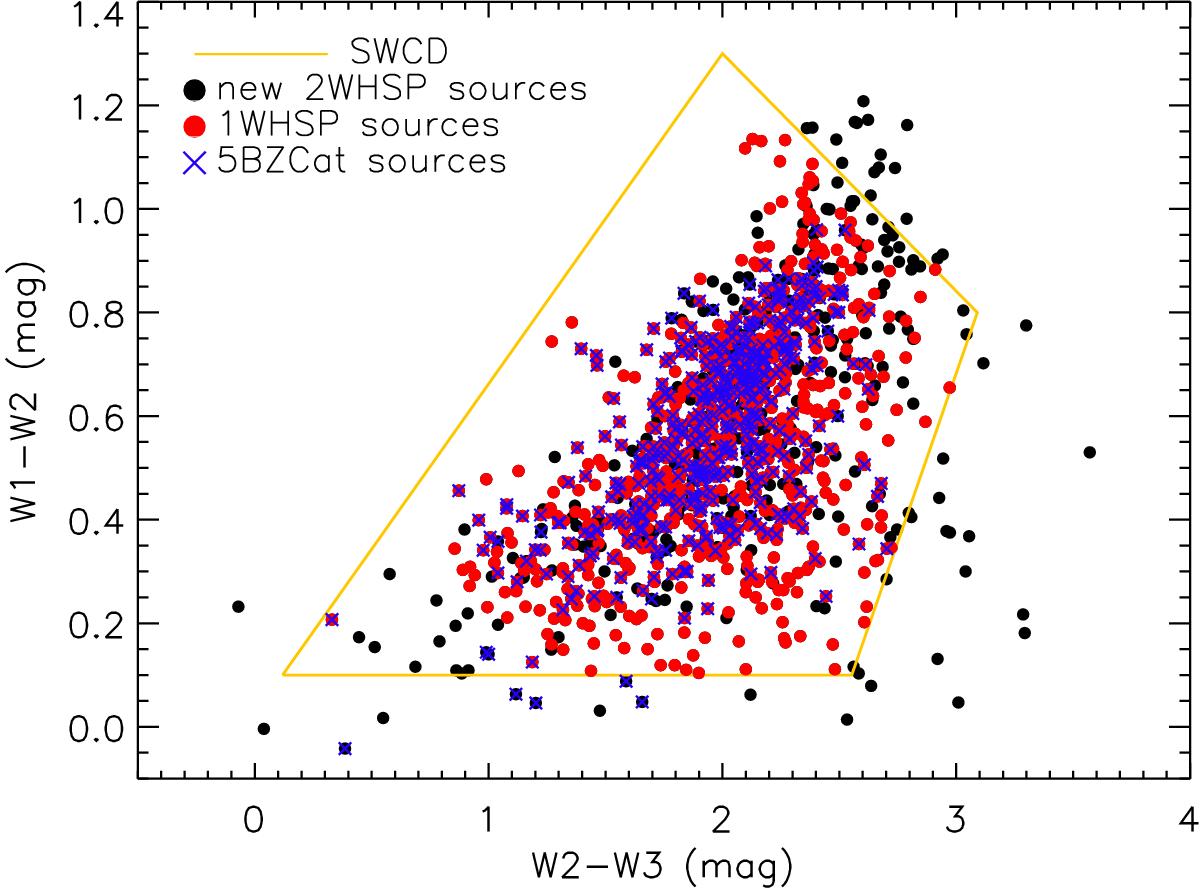
IR colour–colour diagram. The black points are the sources we selected in 2WHSP but not in 1WHSP, the red points are the selected in 1WHSP, the blue crosses are the sources also in 5BZCat. The yellow line marks the SWCD region.
Current usage metrics show cumulative count of Article Views (full-text article views including HTML views, PDF and ePub downloads, according to the available data) and Abstracts Views on Vision4Press platform.
Data correspond to usage on the plateform after 2015. The current usage metrics is available 48-96 hours after online publication and is updated daily on week days.
Initial download of the metrics may take a while.