Fig. 1
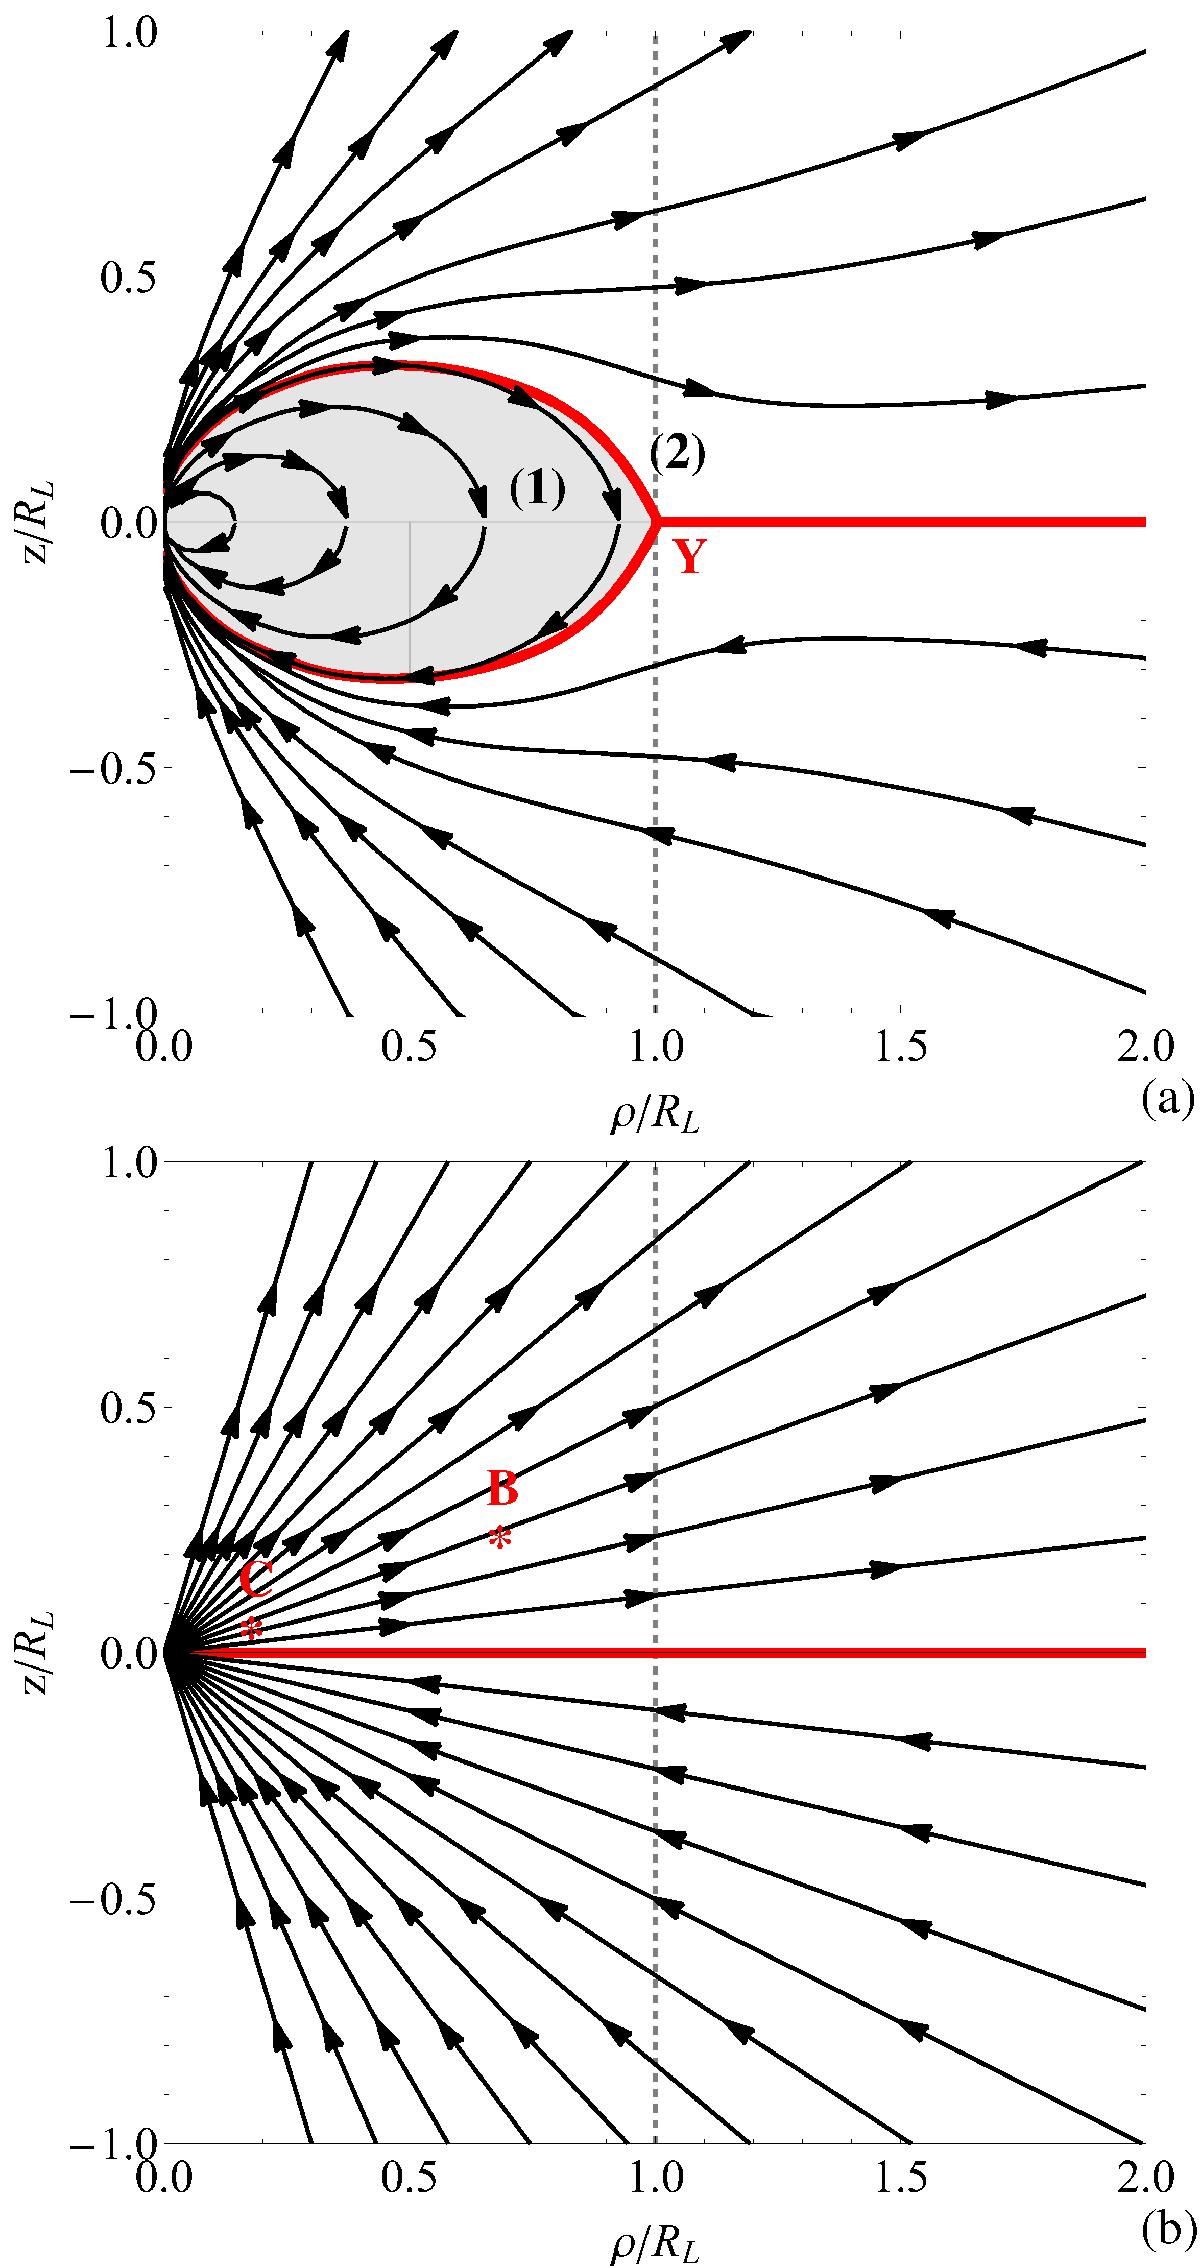
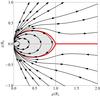
a): Schematic depiction of a poloidal slice of the magnetosphere of an isolated pulsar, reproduced from GLP Fig. 1. The vertical dashed lines mark the location of the LC (ρ/RL = 1, with ρ and z being the cylindrical coordinates measuring the distance to and along the rotation axis, and the LC is at ρ = RL). The red curves represent the CSs that demarcate the different magnetic domains (1) (inside the shaded bubble containing closed field lines) and (2) (open field line region). b): A depiction of the split monopole solution, with a CS on the equatorial plane, facilitating the change of field line direction across it.
Current usage metrics show cumulative count of Article Views (full-text article views including HTML views, PDF and ePub downloads, according to the available data) and Abstracts Views on Vision4Press platform.
Data correspond to usage on the plateform after 2015. The current usage metrics is available 48-96 hours after online publication and is updated daily on week days.
Initial download of the metrics may take a while.