| Issue |
A&A
Volume 598, February 2017
|
|
|---|---|---|
| Article Number | C1 | |
| Number of page(s) | 6 | |
| Section | Interstellar and circumstellar matter | |
| DOI | https://doi.org/10.1051/0004-6361/201528001e | |
| Published online | 26 January 2017 | |
Surface chemistry in photodissociation regions (Corrigendum)
1 Kapteyn Astronomical Institute, University of Groningen, PO Box 800, NL 9700 AV Groningen, The Netherlands
e-mail: This email address is being protected from spambots. You need JavaScript enabled to view it.
2 Leiden Observatory, Leiden University, PO Box 9513, NL 2300 RA Leiden, The Netherlands
3 Max Planck Institute for Extraterrestrial Physics, Giessenbachstrasse 1, 85748 Garching, Germany
Key words: astrochemistry / ISM: abundances / photon-dominated region (PDR) / errata, addenda
1. Introduction
In Table A.5 (page 17) of our original publication (Esplugues et al. 2016), the rate coefficient considered for the CO ice photodesorption was 2.2 × 10⁻¹⁵ s-1, however we should have considered a coefficient of 3.67 × 10⁻¹⁰ s-1 according to recent results (Fayolle et al. 2011; Muñoz-Caro et al. 2016). We also update here the values for the solid species H2O and H2CO considering a coefficient of 3.67 × 10⁻¹¹ s-1 for both of them (see Table 1) instead of 2.16 × 10⁻¹¹ s-1. In particular, the photo-process reaction rate, Rphoto (cm-3 s-1), is calculated for these cases as  (1)where ni is the number density of the photodissociated species, fss is the self-shielding factor, and kphoto (s-1) is the photo-process rate coefficient as follows:
  (2)following Chaparro-Molano & Kamp (2012). In expression (2), χ is the UV field strength (Draine 1978)1, and the photon flux produced by this field per unit area is FDraine = 1.921× 108 cm-2 s-1 (Woitke et al. 2009). Furthermore, nsurf = 1.11× 1015 cm-2 is the surface density of available absorption sites per unit grain area assuming 3 Å separation between sites, Nlay = 2 is the assumed number of ice layers that photons can penetrate for photodesorption (Andersson et al. 2006; Arasa et al. 2010; Muñoz-Caro et al. 2016), and Yi is the photodesorption yield per photon (see Table 2).
Photoreactions on dust grains.
Photoreaction yields.
These corrections lead to variations in some of the results included in the original publication. The variations are mainly produced at visual extinctions AV ≳ 4 mag. In particular, significant differences are found for Model 1 (nH = 104 cm-3, G0 = 104), while results for Model 2 (nH = 106 cm-3, G0 = 104) and Model 3 (nH = 106 cm-3, G0 = 102) are barely affected. We show the new figures for those cases affected by the new rate coefficients below. We also compare these new figures with those from the original paper. In spite of these variations, all the conclusions obtained in Esplugues et al. (2016) remain the same.
2. Cooling
The corrected version of the paper, Fig. 1 (left), shows that cooling by CO becomes dominant at 3 <AV ≲ 5 mag. In the original paper (right), the cooling is dominated by CO and [OI] 63 μm at 3 <AV ≲ 4 mag and by gas-grain collisions at 4 <AV ≲ 5 mag.
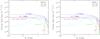 |
Fig. 1 Cooling processes for Model 1 as calculated in the original paper (right) and after the rate coefficient correction (left). |
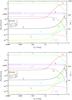 |
Fig. 2 Gas-phase fractional abundances, n(x)/nH, for Model 1 as calculated in the original paper (bottom) and after the rate coefficient correction (top). |
3. Chemical structure
3.1. Gas-phase species
The corrected version of the paper, Fig. 2 (top), shows high CO gas-phase abundances in comparison with those obtained in the original paper (bottom) at 4 ≲ AV ≲ 5 mag. For this visual extinction range, the gas temperature is also lower in the corrected version due to the higher CO contribution to the cooling of the region. The abundances of the other species showed in Fig. 2 present insignificant differences (less than one order of magnitude) between both plots.
3.2. Dust-phase species
Figure 3 (left) shows that, taking the updated rate coefficients into account, one full monolayer of CO2 and H2O ice at AV ≲ 5 mag does not form for Model 1, unlike the original (right) paper (see also Fig. 4 with the exact number of monolayers formed in each case). We also find a significant difference in the abundances of solid H2O2. In particular, with the new photodesorption rate coefficients (left), the H2O2 abundances remain high at 4 <AV ≲ 5 mag in comparison with the original publication (right).
3.3. Ice species formation rates
For chemical reactions forming water ice (Fig. 5), the main difference between the original paper (right) and the corrected version (left) is found in the rates of the reaction between solid H and solid H2O2 for Model 1 at large AV. In spite of this difference, however, we still obtain that the main chemical reaction forming water ice at AV> 4 mag for Model 1 is the reaction between solid H and solid OH.
Figure 6 shows the rates of the reactions forming CO2 ice in the original paper (right) and in the corrected version (left). The main differences between both plots are found once the maximum number of CO2 monolayers is reached (at ~3.5 mag and ~1.5 mag for Models 2 and 3, respectively). For these cases, the CO2 ice formation is dominated by the reaction of solid CO with solid O and solid OH. For Model 1, in the corrected version, we obtain that CO2 is mainly formed only through the reaction between solid CO and solid O at AV ≲ 5 mag. In the original version of the paper, however, we obtain that CO2 ice is formed through solid OH and solid CO at 4.5 ≲ AV ≲ 5 mag.
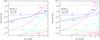 |
Fig. 3 Dust-phase fractional abundances, n(x)/nH, for Model 1 as calculated in the original paper (right) and after the rate coefficient correction (left). The dash-dotted black line represents the number of possible attachable sites on grain surfaces per cm3. JX means solid X. |
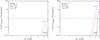 |
Fig. 4 Growth of ice layers on grains surfaces for H2O and CO2 in the original paper (right) and in the corrected version (left). JX means solid X. |
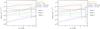 |
Fig. 5 Rates for surface reactions forming H2O ice in the original paper (right) and in the corrected version (left). JX means solid X. |
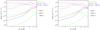 |
Fig. 6 Rates for surface reactions forming CO2 ice in the original paper (right) and in the corrected version (left). JX means solid X. |
4. Desorption probabilities
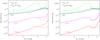 |
Fig. 7 Gas-phase fractional abundances, n(x)/nH, for Model 1 (G0 = 104 and nH = 104) considering different desorption probabilities (δice). Original paper (right) and corrected version (left). |
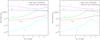 |
Fig. 8 Gas-phase fractional abundances, n(x)/nH, for H, O, CO, H2O, and CO2 from Model 1 (G0 = 104 and nH = 104) with and without considering dust chemistry. Original paper (right) and corrected version (left). |
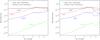 |
Fig. 9 Gas-phase fractional abundances, n(x)/nH, for HCO+, HCN, H2CO, and CH3OH from Model 1 (G0 = 104 and nH = 104) with and without considering dust chemistry. Original paper (right) and corrected version (left). |
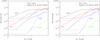 |
Fig. 10 Gas-phase fractional abundances, n(x)/nH, for HCO+, HCN, H2CO, and CH3OH from Model 1 (G0 = 104 and nH = 104) obtained with this PDR code and the version from Meijerink & Spaans (2005). Original paper (right) and corrected version (left). |
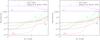 |
Fig. 11 Gas-phase fractional abundances, n(x)/nH, for H, O, CO, H2O, and O2 from Model 1 (G0 = 104 and nH = 104) obtained with this PDR code and the version from Meijerink & Spaans (2005). Original paper (right) and corrected version (left). |
Figure 7 shows abundances for several gas-phase species considering two distinct desorption probabilities (δice). The main differences between both plots are found for CO at large visual extinctions (AV> 4 mag). In particular, while the CO abundances drop at AV ~ 4 mag in the original paper (right), this drop occurs deeper in the cloud (AV ~ 6 mag) in the corrected version (left). It leads to a difference of ~3 orders of magnitude in the CO abundances between both δice in the corrected version of the paper. For H2CO and CH3OH, we still obtain differences of up to two and three orders of magnitude, respectively, between both δice in the corrected paper as in the original publication.
5. Effect of dust in the chemical composition of PDRs
Figures 8 and 9 show a comparison of gas-phase abundances for several species with and without dust chemistry between the original (right) and the corrected paper (left). The main differences are found for CO, CO2, HCO+, and CH3OH. In the corrected version of the paper, the abundances of these species are higher with dust chemistry than without dust chemistry at 4 <AV< 6 mag, unlike the original paper.
6. Comparison with the original Meijerink PDR code
Figures 10 and 11 show gas-phase abundances for several species obtained with this PDR code and with the version from Meijerink & Spaans (2005) for the original paper (right) and the corrected paper (left). In the corrected version, the abundances of HCO+, H2CO, and CH3OH (Fig. 10) are up to two orders of magnitude larger than in the original publication at 4 ≲ AV ≲ 5 mag. In Fig. 11, we find the main difference in the CO abundances between the original paper (right) and the corrected version (left) at 4 ≲ AV ≲ 5 mag. Other species shown in Fig. 11 present differences that are lower than one order of magnitude at 4 ≲ AV ≲ 5 mag. For lower visual extinctions, all the abundances remain unchanged.
Draine field (χ) ≃1.7 × Habing field (G0).
Acknowledgments
The authors thank Evelyne Roueff for pointing out the error of the rate coefficient for the CO photodesorption in our original publication.
References
- Andersson, S., Al-Halabi, A., Kroes, G. J., & van Dishoeck, E. F. 2006, J. Chem. Phys., 124, 064715 [NASA ADS] [CrossRef] [Google Scholar]
- Arasa, C., Andersson, S., Cuppen, H. M., et al. 2010, J. Chem. Phys., 132, 184510 [NASA ADS] [CrossRef] [Google Scholar]
- Chaparro-Molano, G., & Kamp, I. 2012, A&A, 537, A138 [NASA ADS] [CrossRef] [EDP Sciences] [Google Scholar]
- Draine, B. T. 1978, ApJS, 36, 595 [NASA ADS] [CrossRef] [Google Scholar]
- Esplugues, G. B., Cazaux, S., Meijerink, R., et al. 2016, A&A, 591, A52 [NASA ADS] [CrossRef] [EDP Sciences] [Google Scholar]
- Fayolle, E. C., Bertin, M., Romanzin, C., et al. 2011, ApJ, 739, L36 [NASA ADS] [CrossRef] [Google Scholar]
- Guzmán, V., Goicoechea, J. R., Pety, J., et al. 2013, A&A, 560, A73 [NASA ADS] [CrossRef] [EDP Sciences] [Google Scholar]
- Meijerink, R., & Spaans, M. 2005, A&A, 436, 397 [NASA ADS] [CrossRef] [EDP Sciences] [Google Scholar]
- Muñoz-Caro, G. M., Chen, Y. J., Aparicio, S., et al. 2016, A&A, 589, A19 [NASA ADS] [CrossRef] [EDP Sciences] [Google Scholar]
- Öberg, K., Linnartz, H., Visser, R., & van Dishoeck, E. F. 2009b, ApJ, 693, 1209 [NASA ADS] [CrossRef] [Google Scholar]
- Woitke, P., Kamp, I., & Thi, W. F. 2009, A&A, 501, 383 [NASA ADS] [CrossRef] [EDP Sciences] [Google Scholar]
© ESO, 2017
All Tables
All Figures
|
Fig. 1 Cooling processes for Model 1 as calculated in the original paper (right) and after the rate coefficient correction (left). |
| In the text | |
|
Fig. 2 Gas-phase fractional abundances, n(x)/nH, for Model 1 as calculated in the original paper (bottom) and after the rate coefficient correction (top). |
| In the text | |
|
Fig. 3 Dust-phase fractional abundances, n(x)/nH, for Model 1 as calculated in the original paper (right) and after the rate coefficient correction (left). The dash-dotted black line represents the number of possible attachable sites on grain surfaces per cm3. JX means solid X. |
| In the text | |
|
Fig. 4 Growth of ice layers on grains surfaces for H2O and CO2 in the original paper (right) and in the corrected version (left). JX means solid X. |
| In the text | |
|
Fig. 5 Rates for surface reactions forming H2O ice in the original paper (right) and in the corrected version (left). JX means solid X. |
| In the text | |
|
Fig. 6 Rates for surface reactions forming CO2 ice in the original paper (right) and in the corrected version (left). JX means solid X. |
| In the text | |
|
Fig. 7 Gas-phase fractional abundances, n(x)/nH, for Model 1 (G0 = 104 and nH = 104) considering different desorption probabilities (δice). Original paper (right) and corrected version (left). |
| In the text | |
|
Fig. 8 Gas-phase fractional abundances, n(x)/nH, for H, O, CO, H2O, and CO2 from Model 1 (G0 = 104 and nH = 104) with and without considering dust chemistry. Original paper (right) and corrected version (left). |
| In the text | |
|
Fig. 9 Gas-phase fractional abundances, n(x)/nH, for HCO+, HCN, H2CO, and CH3OH from Model 1 (G0 = 104 and nH = 104) with and without considering dust chemistry. Original paper (right) and corrected version (left). |
| In the text | |
|
Fig. 10 Gas-phase fractional abundances, n(x)/nH, for HCO+, HCN, H2CO, and CH3OH from Model 1 (G0 = 104 and nH = 104) obtained with this PDR code and the version from Meijerink & Spaans (2005). Original paper (right) and corrected version (left). |
| In the text | |
|
Fig. 11 Gas-phase fractional abundances, n(x)/nH, for H, O, CO, H2O, and O2 from Model 1 (G0 = 104 and nH = 104) obtained with this PDR code and the version from Meijerink & Spaans (2005). Original paper (right) and corrected version (left). |
| In the text | |
Current usage metrics show cumulative count of Article Views (full-text article views including HTML views, PDF and ePub downloads, according to the available data) and Abstracts Views on Vision4Press platform.
Data correspond to usage on the plateform after 2015. The current usage metrics is available 48-96 hours after online publication and is updated daily on week days.
Initial download of the metrics may take a while.