Free Access
Fig. 5
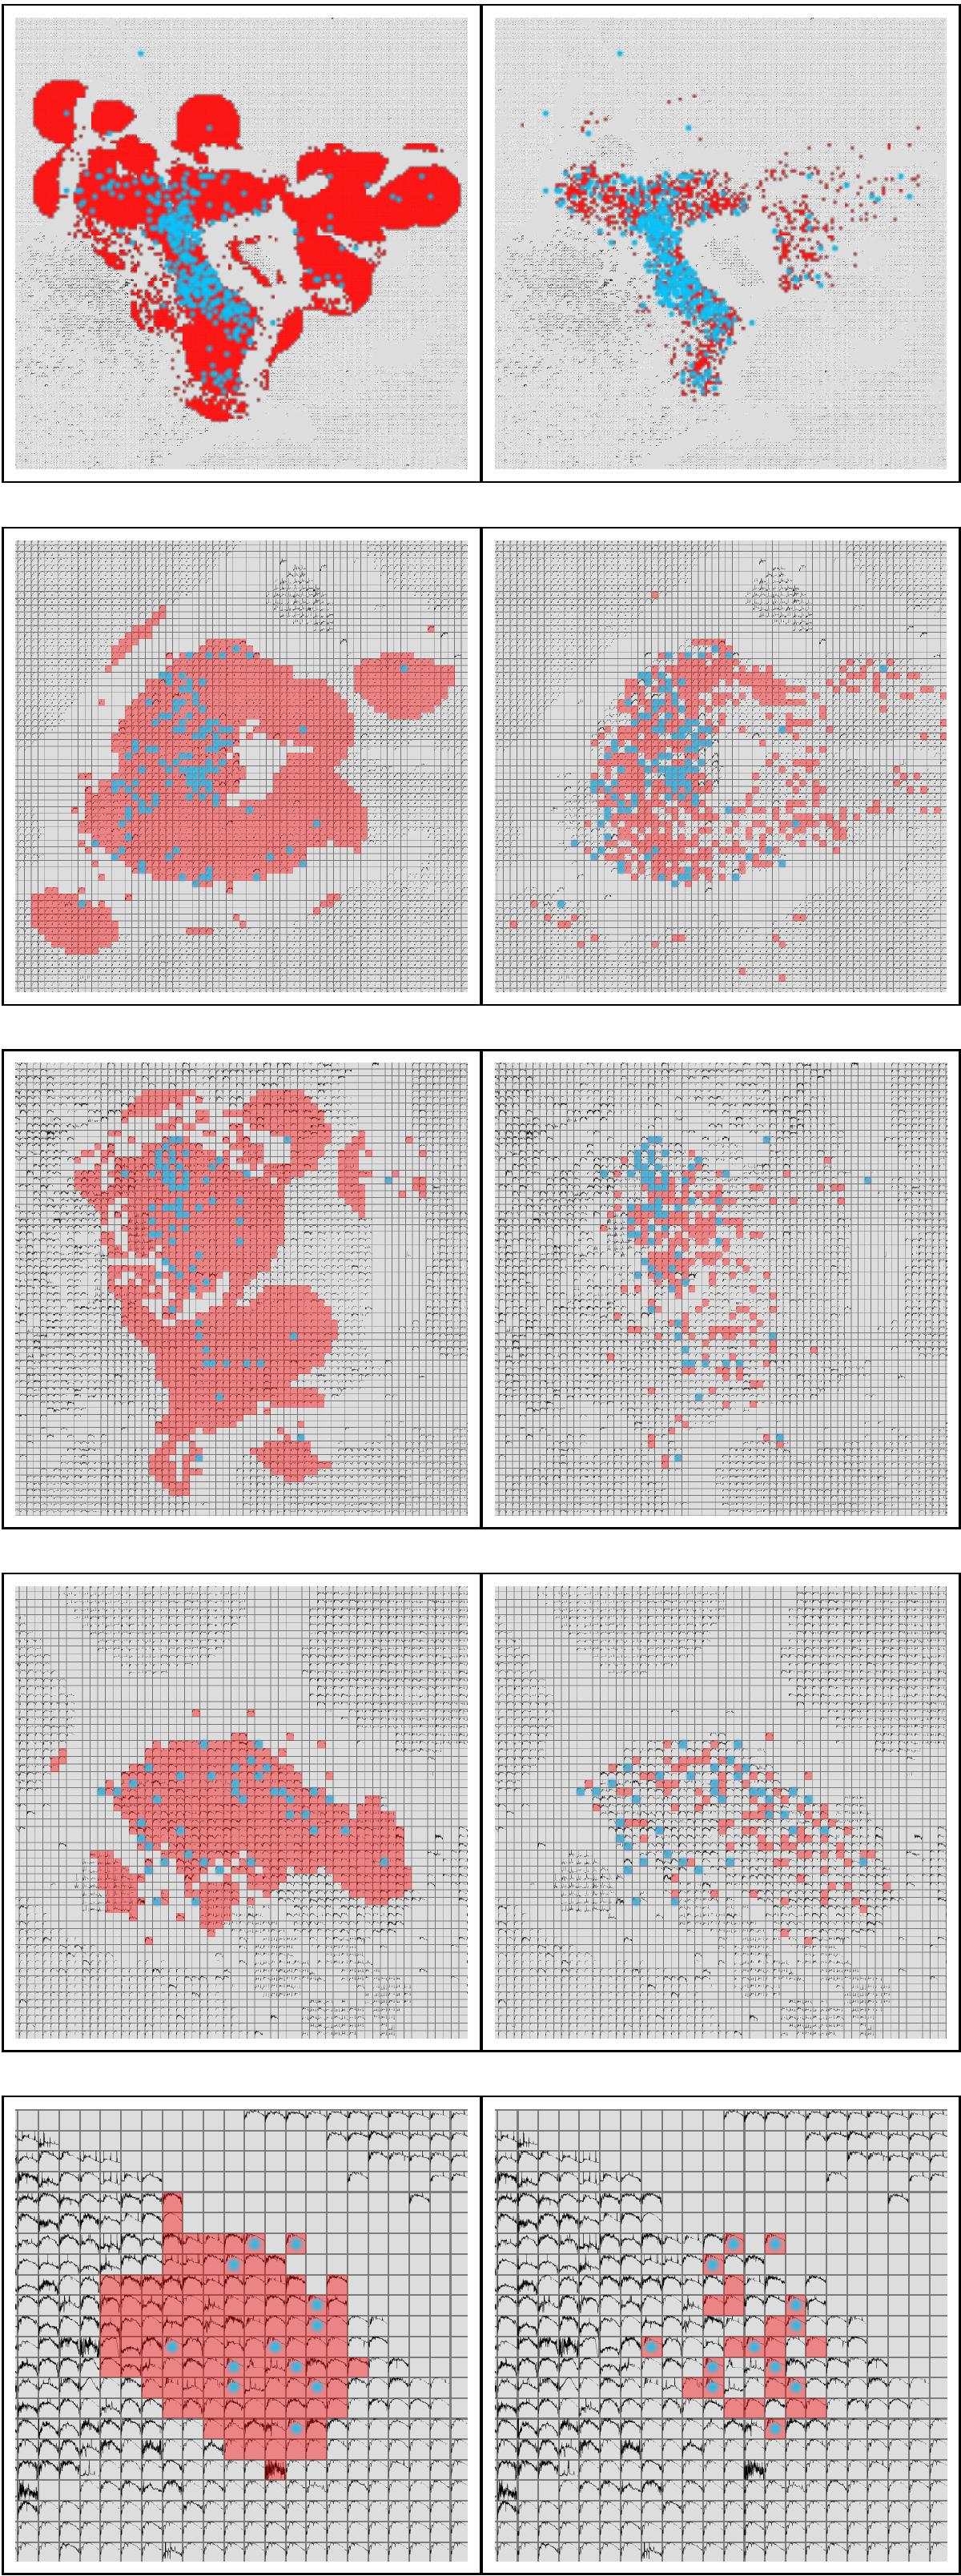
Cutouts from the icon map containing the E+A clusters 1 to 5 (top to bottom; first selection on the left side, final selection on the right side). Galaxies from the input catalogue are marked blue. The red background colour indicates the newly selected E+A galaxies.
Current usage metrics show cumulative count of Article Views (full-text article views including HTML views, PDF and ePub downloads, according to the available data) and Abstracts Views on Vision4Press platform.
Data correspond to usage on the plateform after 2015. The current usage metrics is available 48-96 hours after online publication and is updated daily on week days.
Initial download of the metrics may take a while.