Free Access
Fig. 4
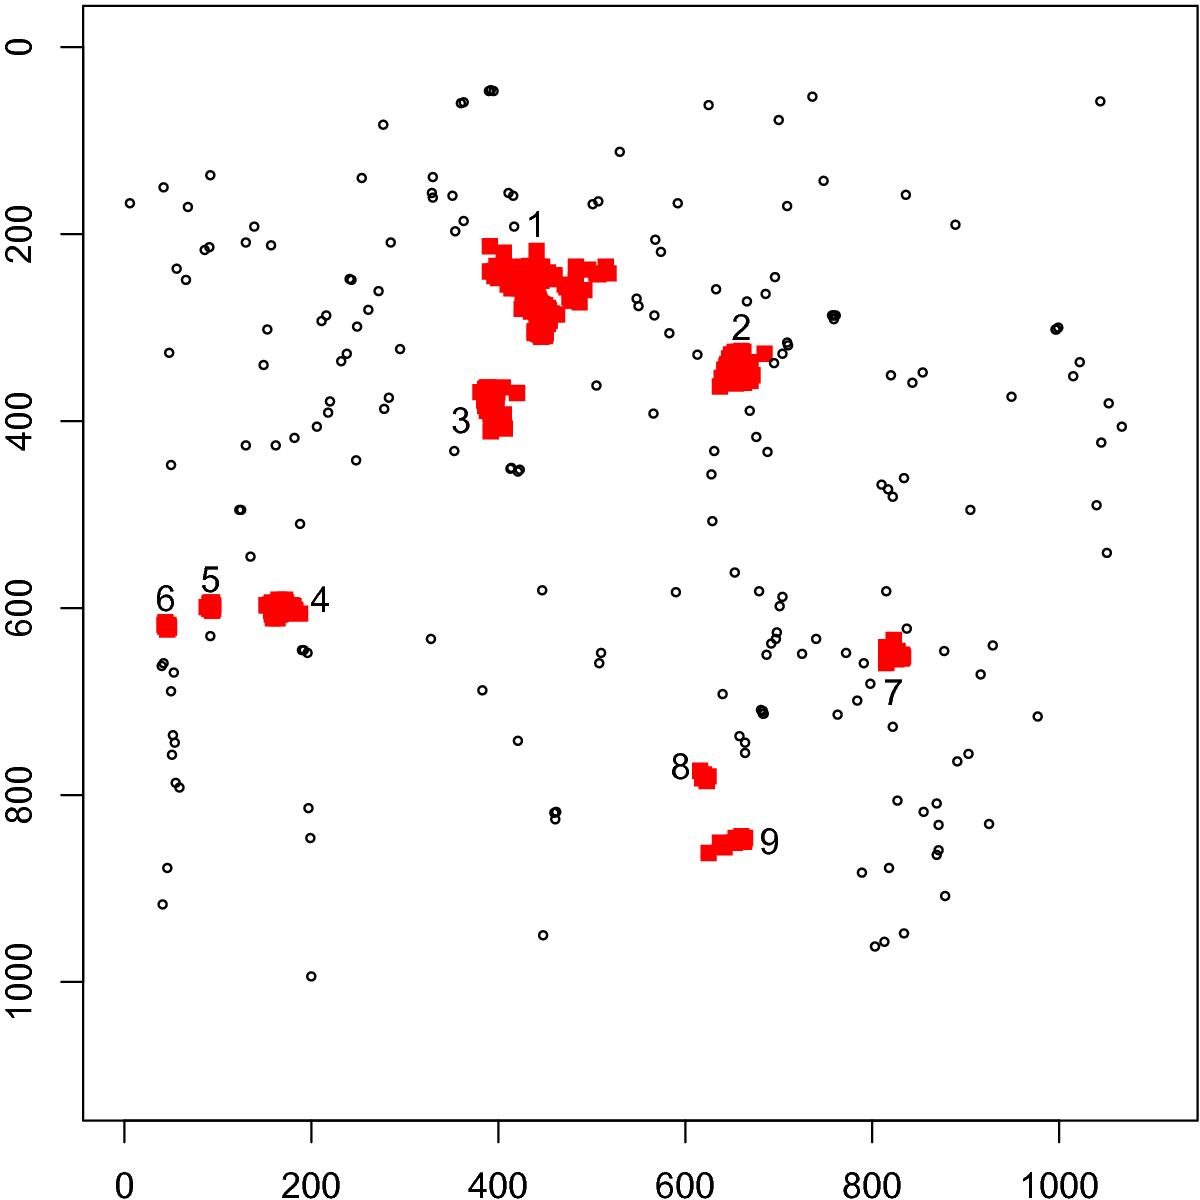
Distribution of Goto galaxies (black open circles) over the SOM. The clusters identified by dbscan clustering are shown as red squares and labelled by the cluster ID. The axis are the pixel coordinates of the SOM.
Current usage metrics show cumulative count of Article Views (full-text article views including HTML views, PDF and ePub downloads, according to the available data) and Abstracts Views on Vision4Press platform.
Data correspond to usage on the plateform after 2015. The current usage metrics is available 48-96 hours after online publication and is updated daily on week days.
Initial download of the metrics may take a while.