Free Access
Fig. 1
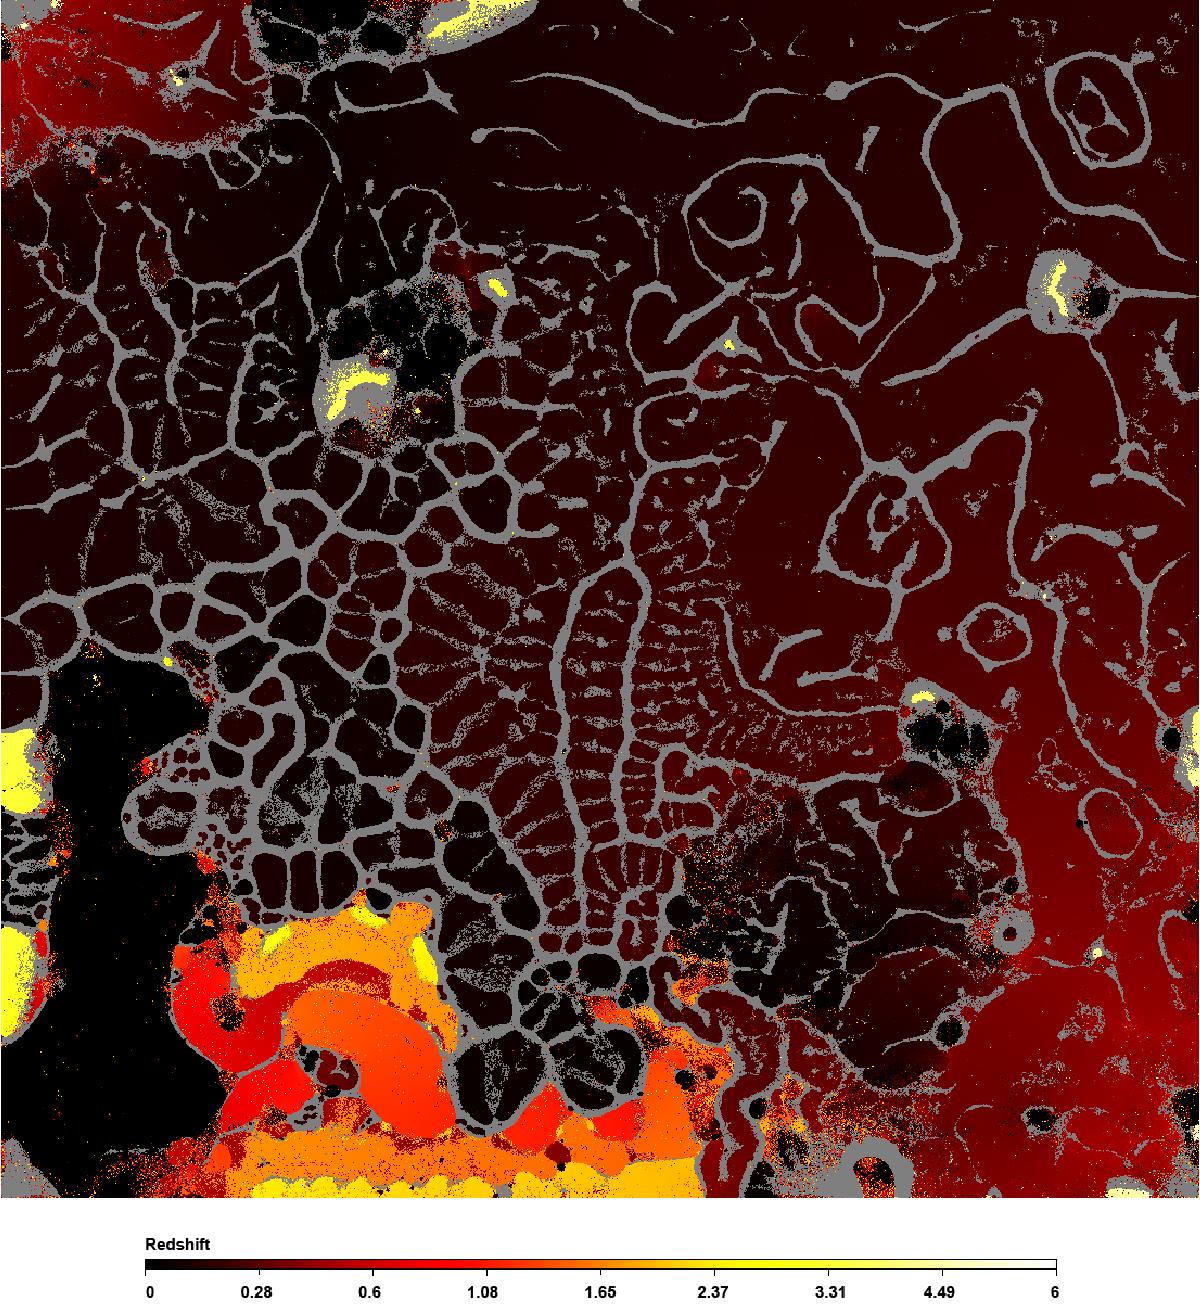
Kohonen SOM of ~106 spectra from SDSS DR7 in its representation as a redshift map. Each pixel corresponds to one spectrum where the colour represents the redshift z from 0 (dark) to 6 (bright yellow). The grey dots are empty neurons.
Current usage metrics show cumulative count of Article Views (full-text article views including HTML views, PDF and ePub downloads, according to the available data) and Abstracts Views on Vision4Press platform.
Data correspond to usage on the plateform after 2015. The current usage metrics is available 48-96 hours after online publication and is updated daily on week days.
Initial download of the metrics may take a while.