Fig. 8
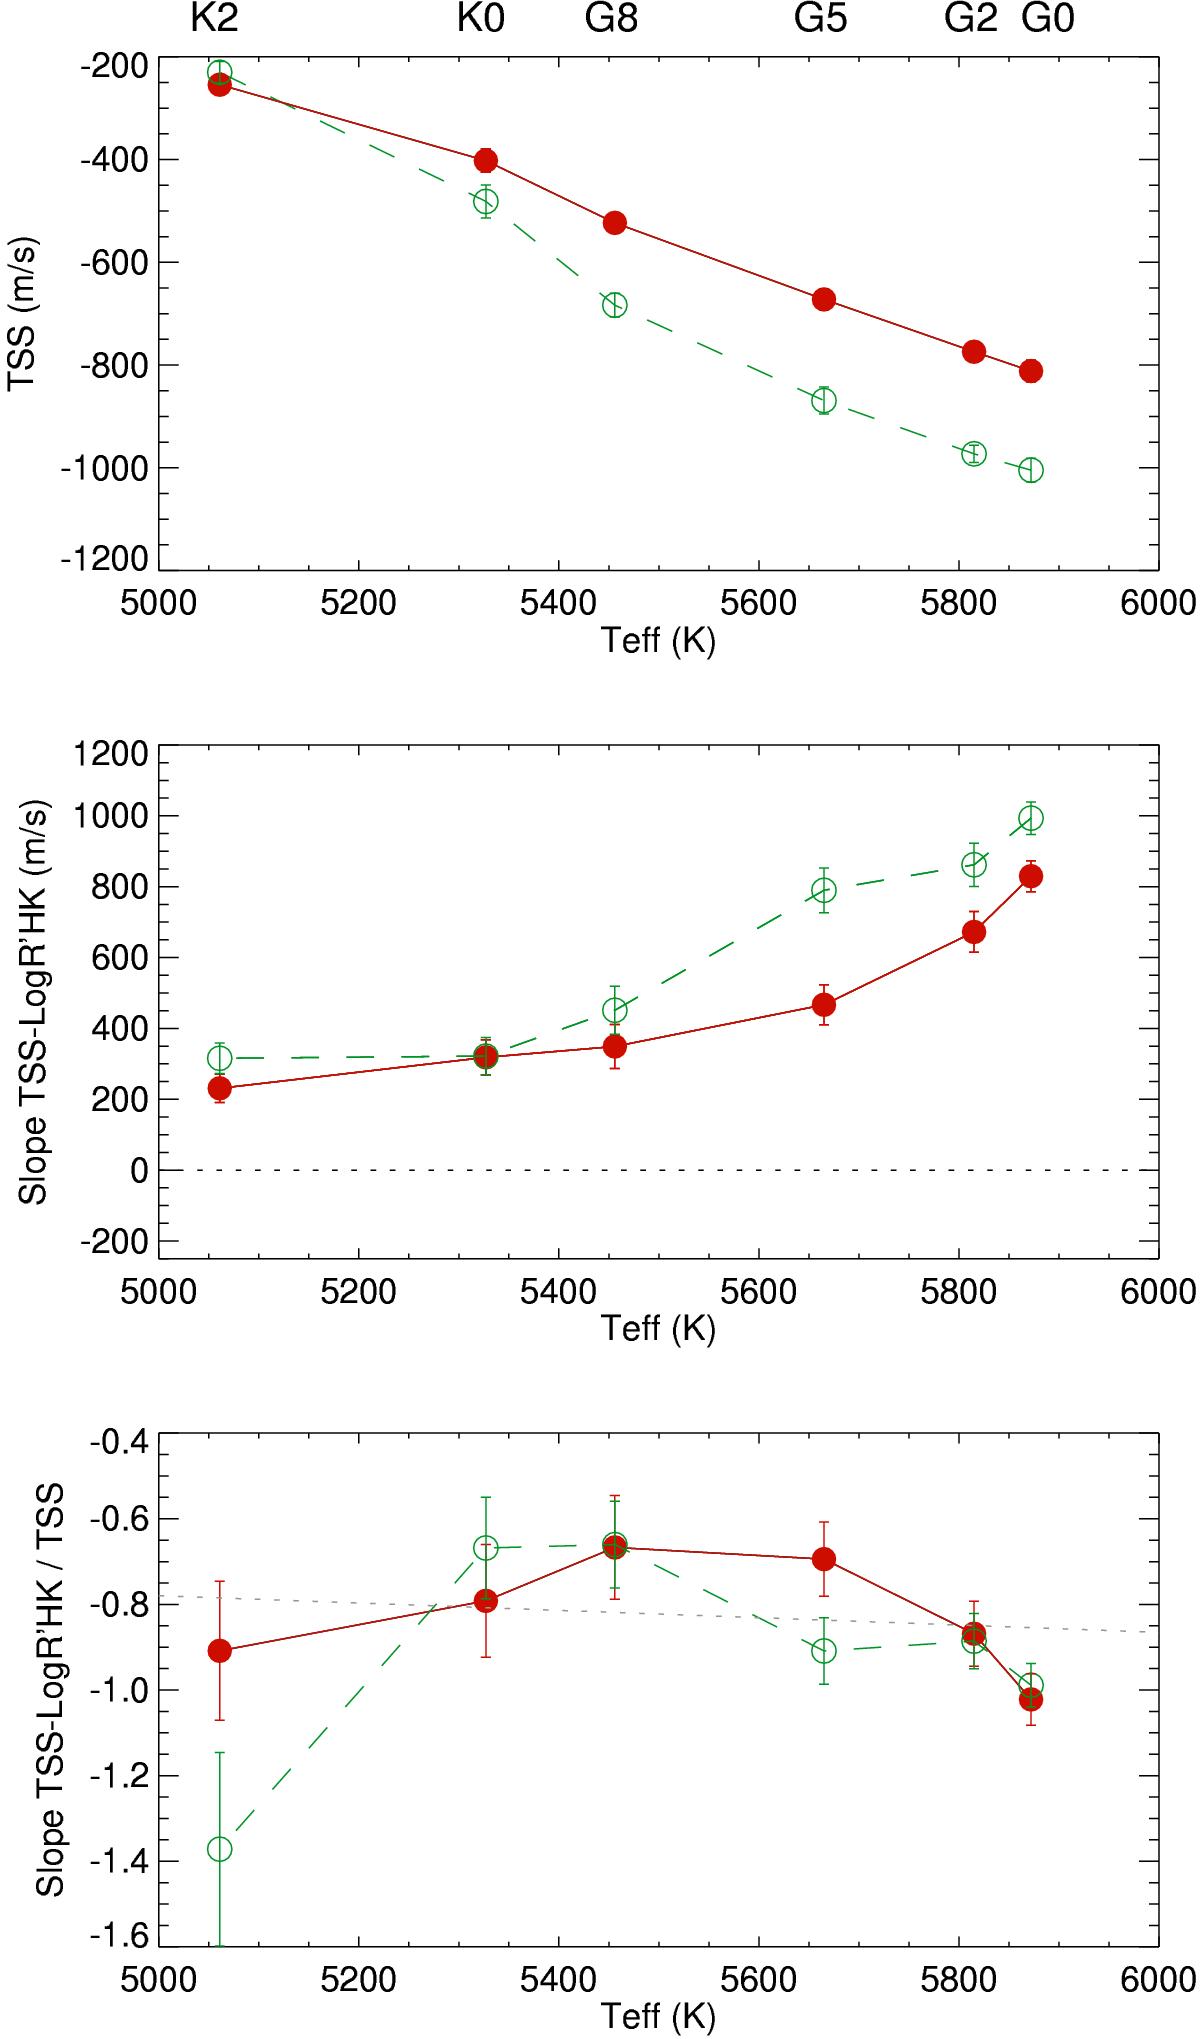
Upper panel: TSS (slope of the differential velocity shifts of spectral lines, in m/s/(F/Fc)) averaged for each sample versus the average temperature of the sample (red filled circles and solid line). The green curve (open circles and dashed line) shows the TSS after the wavelength dependence correction. Middle panel: same for the slope of the TSS versus Log ![]() . Lower panel: same for the ratio between this slope and the TSS. The dotted line is a linear fit on the ratio in red.
. Lower panel: same for the ratio between this slope and the TSS. The dotted line is a linear fit on the ratio in red.
Current usage metrics show cumulative count of Article Views (full-text article views including HTML views, PDF and ePub downloads, according to the available data) and Abstracts Views on Vision4Press platform.
Data correspond to usage on the plateform after 2015. The current usage metrics is available 48-96 hours after online publication and is updated daily on week days.
Initial download of the metrics may take a while.