Free Access
Fig. 6
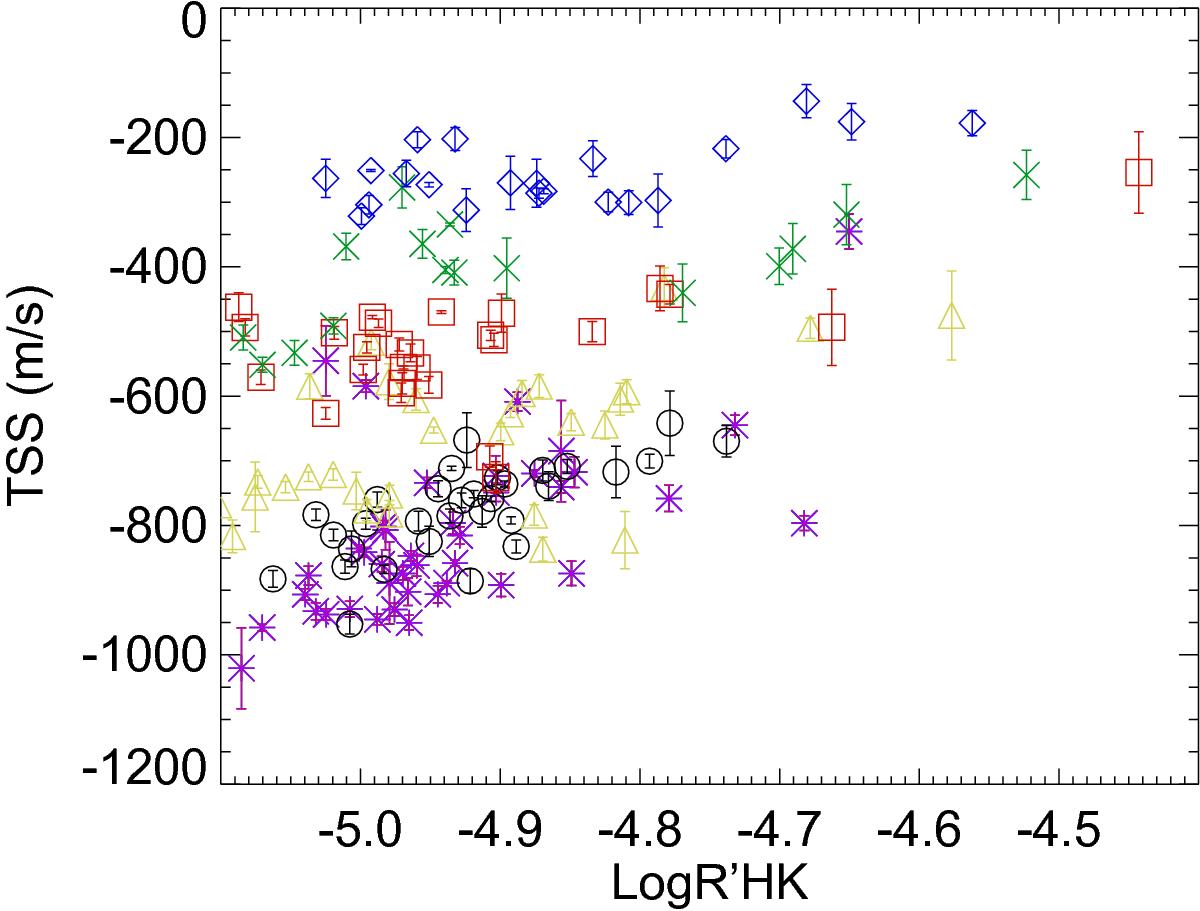
TSS (slope of the differential velocity shifts of spectral lines, in m/s/(F/Fc)) versus Log ![]() for all stars in each sample (same colour and symbol codes as in Fig. 2).
for all stars in each sample (same colour and symbol codes as in Fig. 2).
Current usage metrics show cumulative count of Article Views (full-text article views including HTML views, PDF and ePub downloads, according to the available data) and Abstracts Views on Vision4Press platform.
Data correspond to usage on the plateform after 2015. The current usage metrics is available 48-96 hours after online publication and is updated daily on week days.
Initial download of the metrics may take a while.