Fig. 5
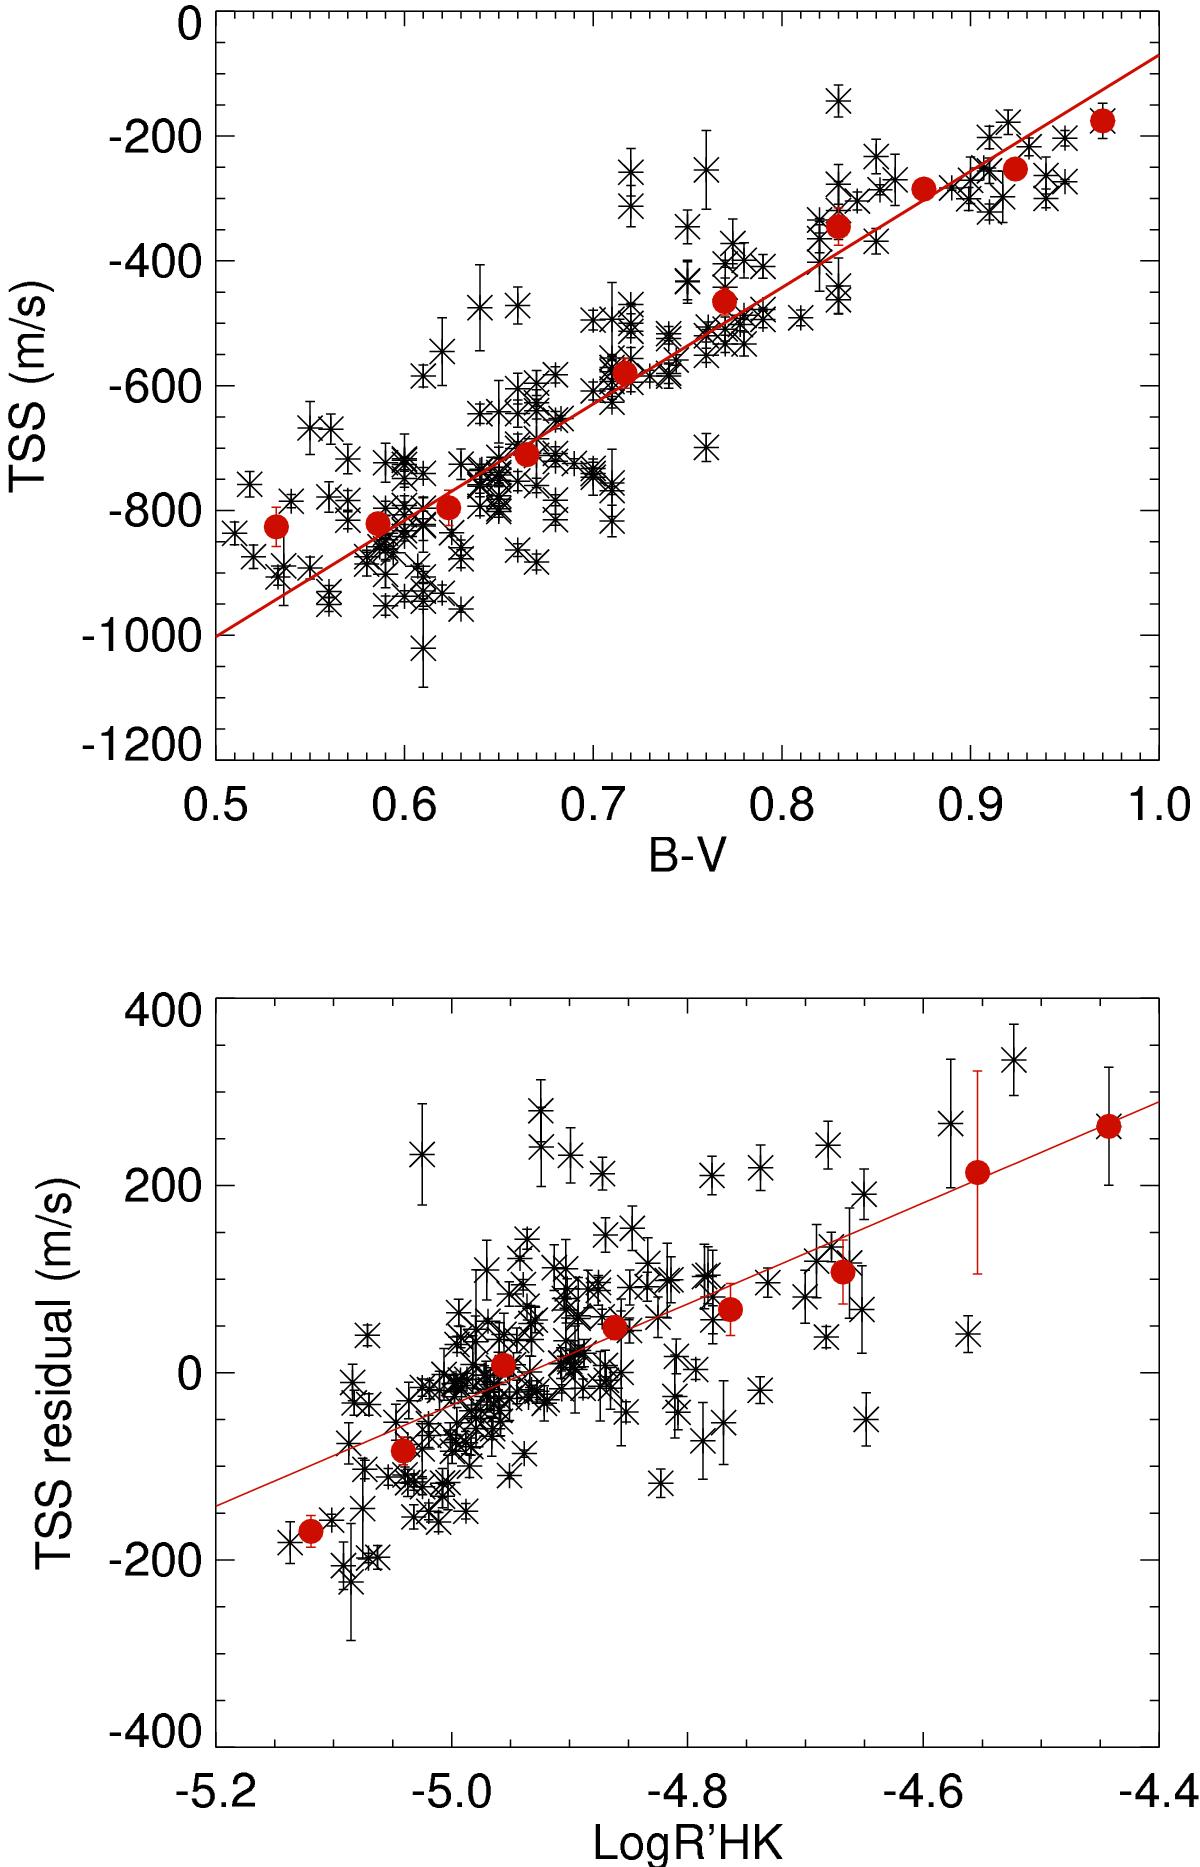
Upper panel: TSS (slope of the differential velocity shifts of spectral lines, in m/s/(F/Fc)) versus the B−V of the stars. The solid line indicates a linear fit while the red dots correspond to TSS averaged over bins in B−V. Lower panel: residual of the TSS after correction of the B−V dependence versus Log ![]() . The solid line is a linear fit to the TSS.
. The solid line is a linear fit to the TSS.
Current usage metrics show cumulative count of Article Views (full-text article views including HTML views, PDF and ePub downloads, according to the available data) and Abstracts Views on Vision4Press platform.
Data correspond to usage on the plateform after 2015. The current usage metrics is available 48-96 hours after online publication and is updated daily on week days.
Initial download of the metrics may take a while.