Fig. 3
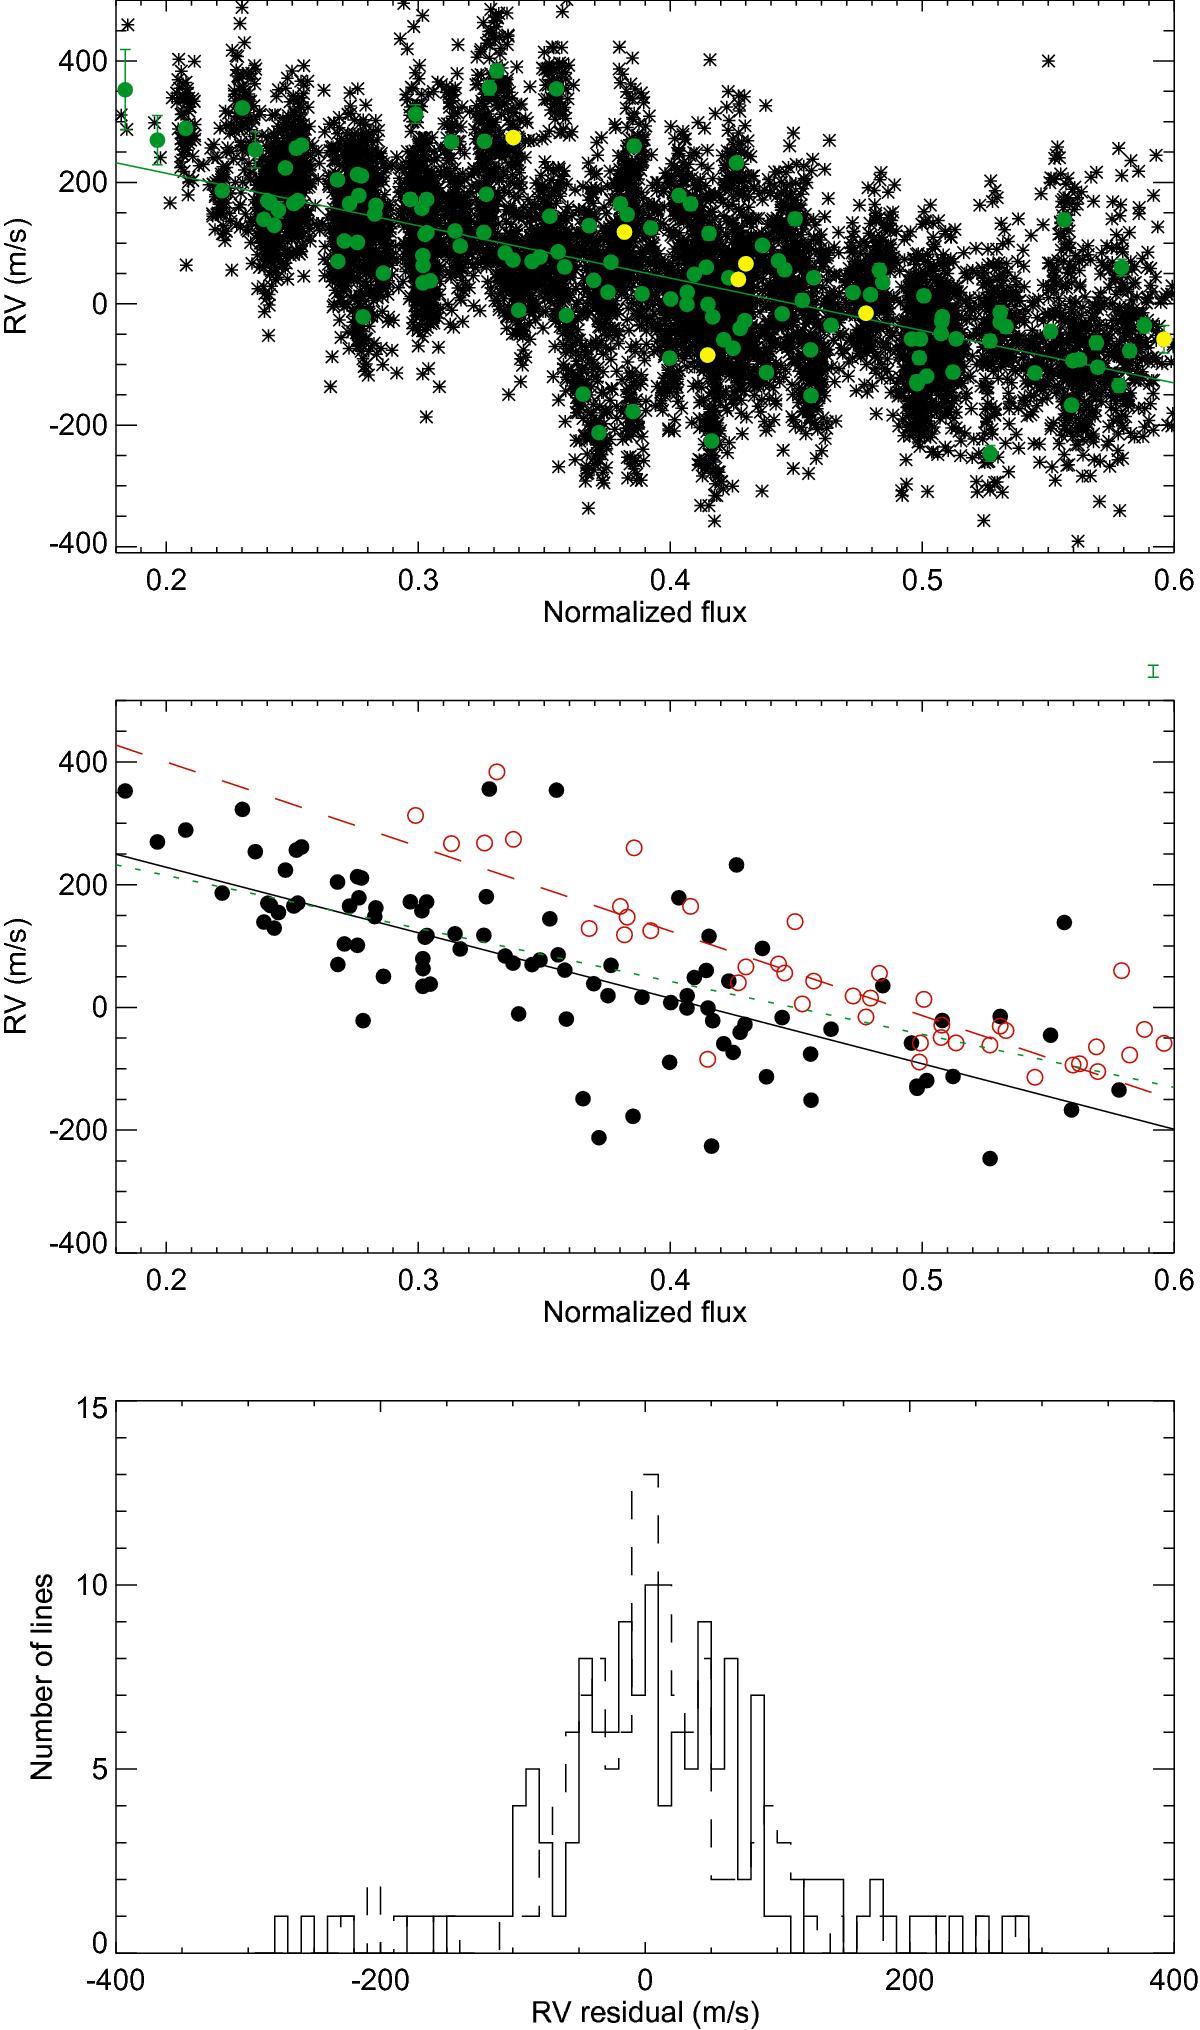
Upper panel: RV versus a normalised flux of the bottom of the lines for HD 223171 (G2), for lines deeper than the 0.6 threshold. Crosses represent individual measurements while green dots correspond to the temporal average for each line. The yellow dots are lines used by Gray (2009). The straight line is a linear fit on the green dots. Middle panel: same as above but showing the wavelength dependence: the black filled circles and solid line are for lines with wavelength below 5750 Å, while the red open circles and dashed lines are for wavelengths above 5750 Å. The green dotted line is the linear fit on all points. Lower panel: distribution of the RV residual after removal of the linear fit, that is, the green dots of the upper panel (solid line). The rms RV is 84 m/s. The dashed line shows the same distribution but for the residual computed after the wavelength-dependence correction (see text), and the rms RV is 78 m/s.
Current usage metrics show cumulative count of Article Views (full-text article views including HTML views, PDF and ePub downloads, according to the available data) and Abstracts Views on Vision4Press platform.
Data correspond to usage on the plateform after 2015. The current usage metrics is available 48-96 hours after online publication and is updated daily on week days.
Initial download of the metrics may take a while.