Fig. B.2
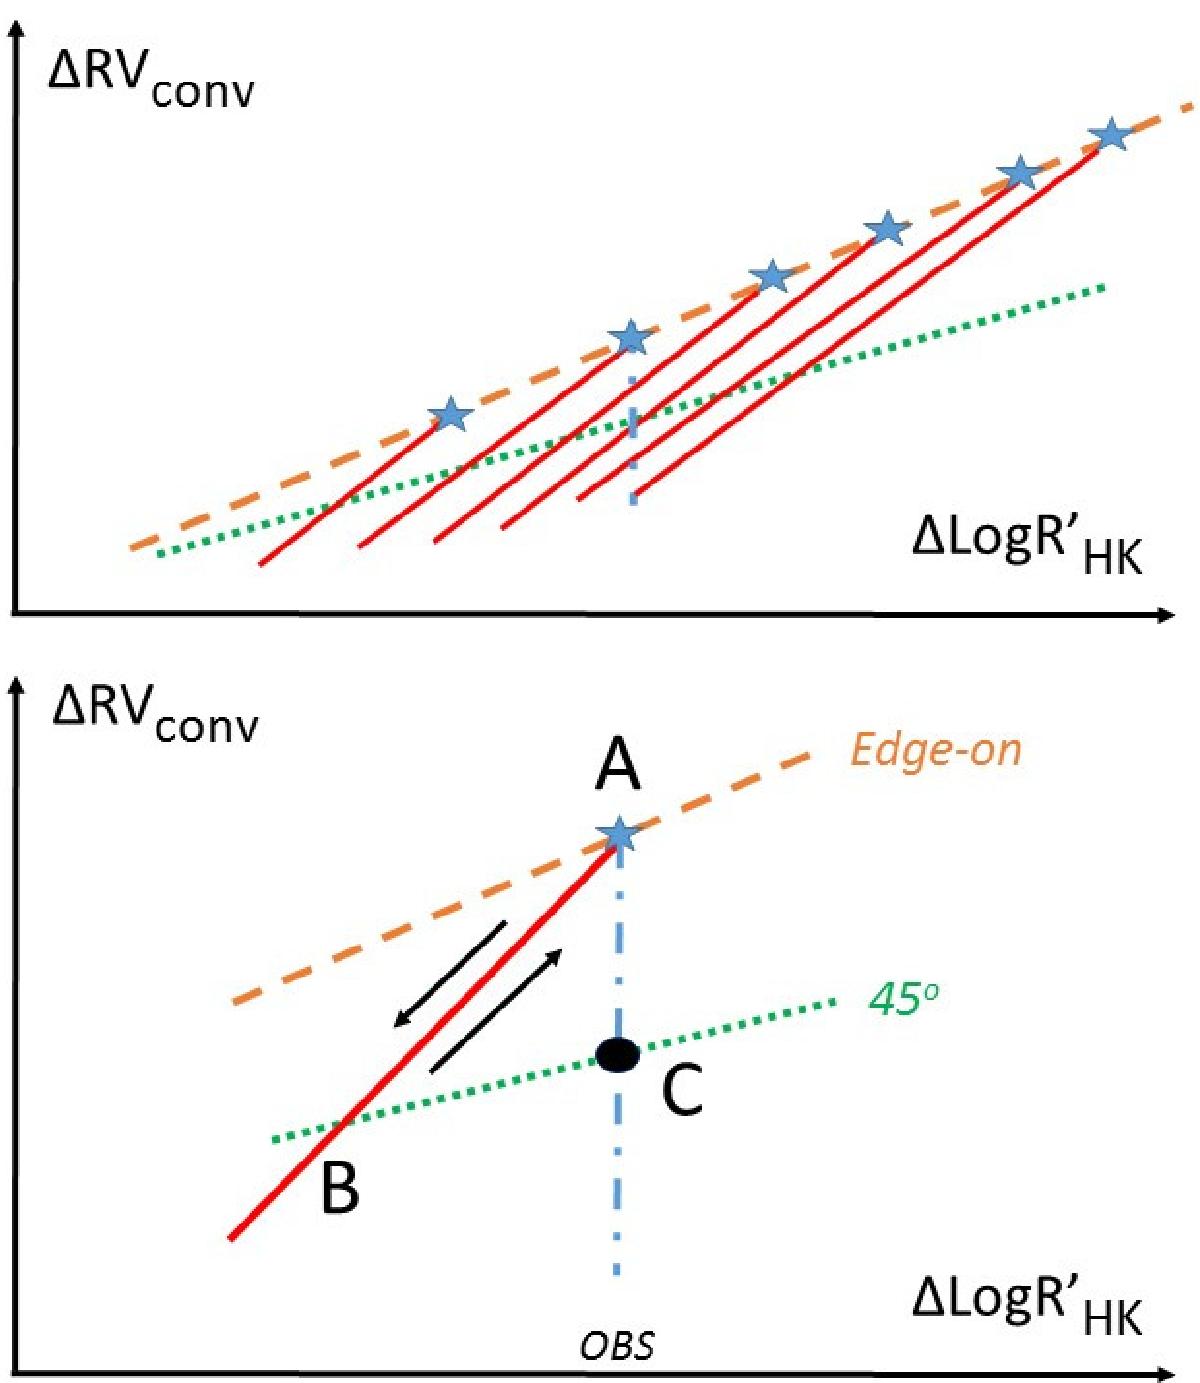
Upper panel: schematic view of ΔRVconv versus ![]() showing the impact of inclination for a star at a given temperature and different activity levels: seen equator-on (orange dashed line with blue stars), at 45° (dotted green line). The red tracks correspond to the various inclinations for each blue star. The vertical dotted-dashed blue thick line corresponds to the various ΔRVconv that would correspond to different inclinations for a given observed
showing the impact of inclination for a star at a given temperature and different activity levels: seen equator-on (orange dashed line with blue stars), at 45° (dotted green line). The red tracks correspond to the various inclinations for each blue star. The vertical dotted-dashed blue thick line corresponds to the various ΔRVconv that would correspond to different inclinations for a given observed ![]() . Lower panel: same zoomed in on one particular observation (see text).
. Lower panel: same zoomed in on one particular observation (see text).
Current usage metrics show cumulative count of Article Views (full-text article views including HTML views, PDF and ePub downloads, according to the available data) and Abstracts Views on Vision4Press platform.
Data correspond to usage on the plateform after 2015. The current usage metrics is available 48-96 hours after online publication and is updated daily on week days.
Initial download of the metrics may take a while.