Fig. 13
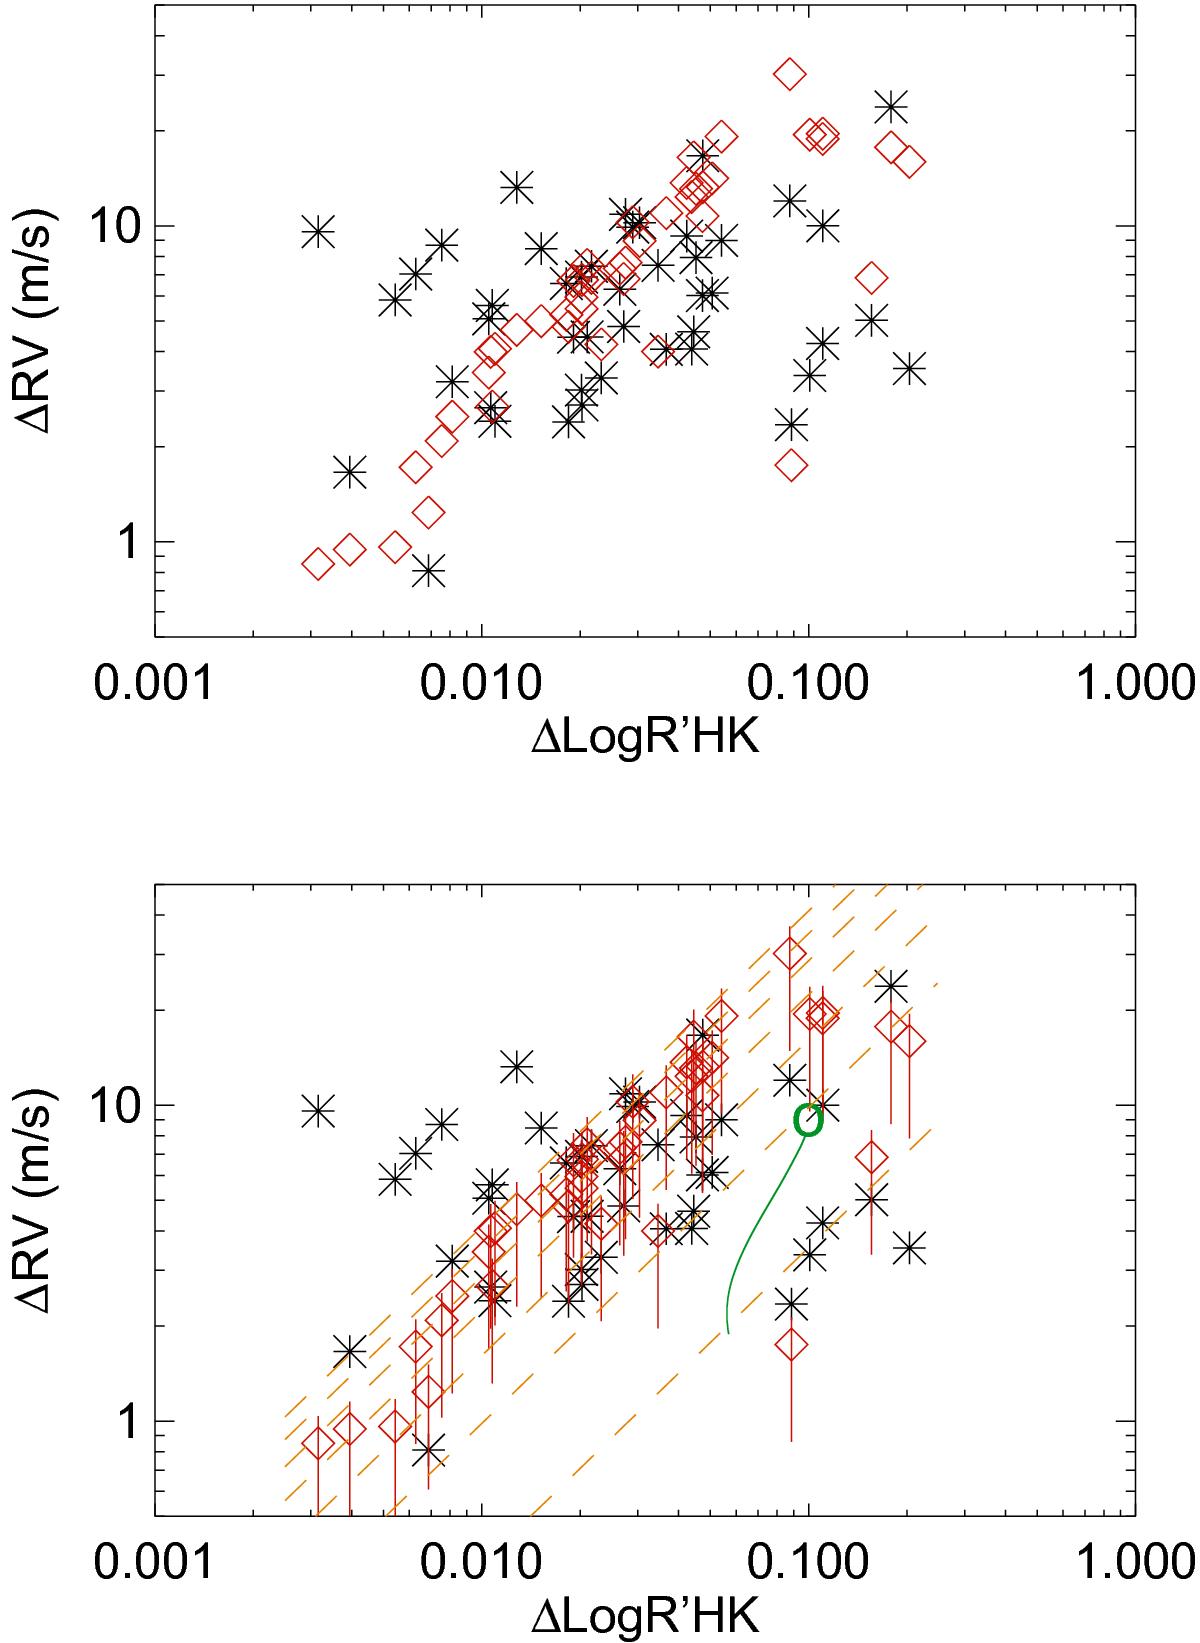
Upper panel: ΔRVobs versus the amplitude of the Log ![]() , on averaged time series (see text), in black. ΔRVconv is shown in red. Lower panel: same as the upper panel. Red vertical lines correspond to the ΔRVconv reconstructed for inclinations of the rotational axis in the range 10–90°. The green circle is the solar value (seen equator-on), and the green line indicates what the solar value would be for various inclinations. The orange dashed line corresponds to ΔRVconv reconstructed from Eq. (5) for Teff between 4950 K (lower curve) and 6150 K (higher curve) with a step of 200 K between each curve.
, on averaged time series (see text), in black. ΔRVconv is shown in red. Lower panel: same as the upper panel. Red vertical lines correspond to the ΔRVconv reconstructed for inclinations of the rotational axis in the range 10–90°. The green circle is the solar value (seen equator-on), and the green line indicates what the solar value would be for various inclinations. The orange dashed line corresponds to ΔRVconv reconstructed from Eq. (5) for Teff between 4950 K (lower curve) and 6150 K (higher curve) with a step of 200 K between each curve.
Current usage metrics show cumulative count of Article Views (full-text article views including HTML views, PDF and ePub downloads, according to the available data) and Abstracts Views on Vision4Press platform.
Data correspond to usage on the plateform after 2015. The current usage metrics is available 48-96 hours after online publication and is updated daily on week days.
Initial download of the metrics may take a while.