Free Access
Fig. 12
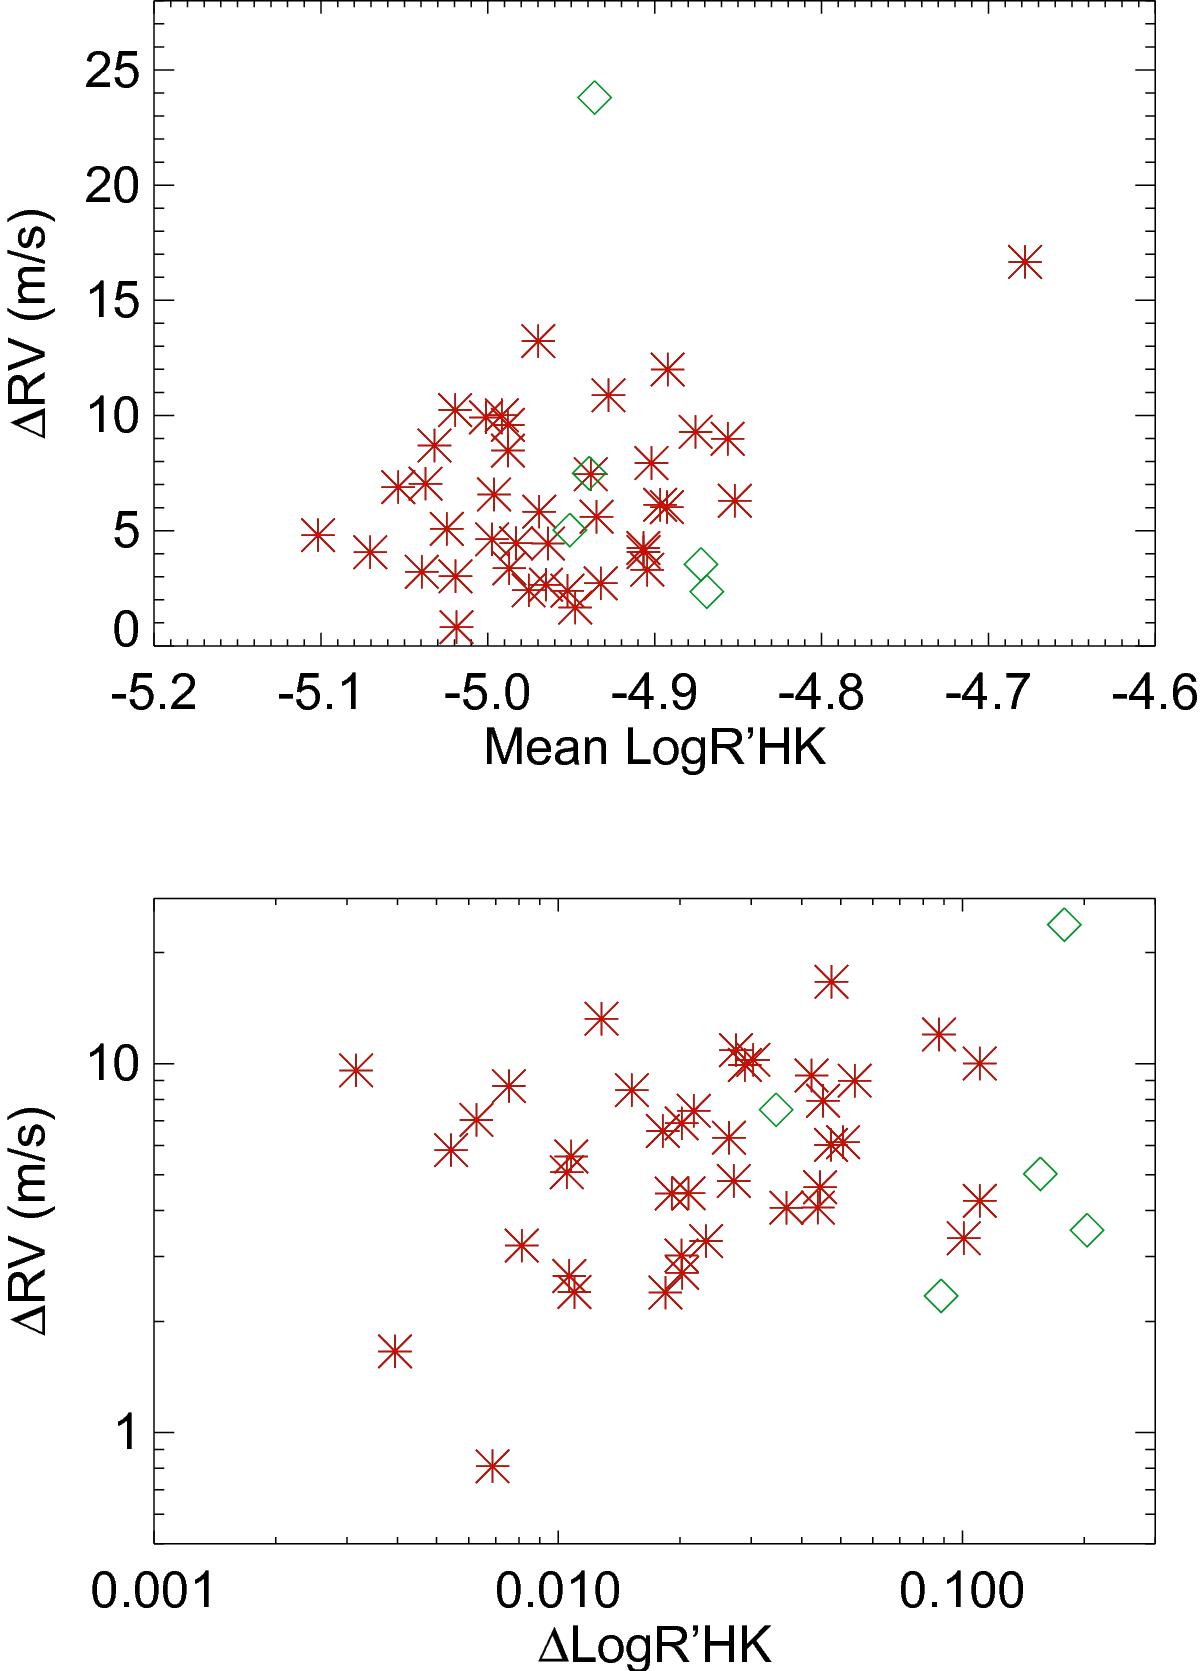
Upper panel: ΔRVobs versus the average Log ![]() , computed on the binned time series and for the 43 stars with more than two bins (see text), for G (red stars) and K (green diamonds) stars. Lower panel: same versus ΔLog
, computed on the binned time series and for the 43 stars with more than two bins (see text), for G (red stars) and K (green diamonds) stars. Lower panel: same versus ΔLog ![]() .
.
Current usage metrics show cumulative count of Article Views (full-text article views including HTML views, PDF and ePub downloads, according to the available data) and Abstracts Views on Vision4Press platform.
Data correspond to usage on the plateform after 2015. The current usage metrics is available 48-96 hours after online publication and is updated daily on week days.
Initial download of the metrics may take a while.