| Issue |
A&A
Volume 596, December 2016
|
|
|---|---|---|
| Article Number | A113 | |
| Number of page(s) | 12 | |
| Section | Stellar atmospheres | |
| DOI | https://doi.org/10.1051/0004-6361/201629103 | |
| Published online | 13 December 2016 | |
The seven sisters DANCe
II. Proper motions and the lithium rotation-activity connection for G and K Pleiades⋆
1 Depto. Astrofísica, Centro de Astrobiología (INTA-CSIC), ESAC campus, Camino Bajo del Castillo s/n, 28692 Villanueva de la Cañada, Spain
e-mail: barrado@cab.inta-csic.es
2 UJF-Grenoble 1/CNRS-INSU, Institut de Planétologie et d’Astrophysique de Grenoble (IPAG), UMR 5274, 38041 Grenoble, France
3 Dpto. de Inteligencia Artificial, ETSI Informática, UNED, Juan del Rosal, 16, 28040 Madrid, Spain
4 CEA/IRFU/SAp, Laboratoire AIM Paris-Saclay, CNRS/INSU, Université Paris Diderot, Observatoire de Paris, PSL Research University, 91191 Gif-sur-Yvette Cedex, France
5 Spitzer Science Center, California Institute of Technology, Pasadena, CA 91125, USA
6 European Southern Observatory, Alonso de Cordova 3107, Vitacura Casilla 19001, Santiago 19, Chile
7 European Space Agency XMM-Newton Science Operations Centre, European Space Astronomy Centre, PO Box 50727, Villafranca del Castillo, 28080 Madrid, Spain
Received: 13 June 2016
Accepted: 30 July 2016
Context. Stellar clusters open the window to understanding stellar evolution and, in particular, the change with time and the dependence on mass of different stellar properties. As such, stellar clusters act as laboratories where different theories can be tested.
Aims. We try to understand the origin of the connection between lithium depletion in F, G, and K stars, rotation and activity in the Pleiades open cluster.
Methods. We have collected all the relevant data in the literature, including information regarding rotation period, binarity, and activity, and cross-matched this data with proper motions, multiwavelength photometry, and membership probability from the DANCe database. To avoid biases, we only included single members of the Pleiades with probabilities larger than 75% in the discussion.
Results. The analysis confirms that there is a strong link between activity, rotation, and the lithium equivalent width excess, especially for the range Lum(bol) = 0.5–0.2L⊙ (about K2–K7 spectral types or 0.75–0.95 M⊙).
Conclusions. It is not possible to disentangle these effects, but we cannot exclude that the observed lithium overabundance is partially an observational effect from enhanced activity owing to a large coverage by stellar spots induced by high rotation rates. Since a bona fide lithium enhancement is present in young, fast rotators, both activity and rotation should play a role in the lithium problem.
Key words: stars: abundances / open clusters and associations: general / starspots / stars: rotation / stars: pre-main sequence / stars: late-type
Tables 1–3 are only available at the CDS via anonymous ftp to cdsarc.u-strasbg.fr (130.79.128.5) or via http://cdsarc.u-strasbg.fr/viz-bin/qcat?J/A+A/596/A113
© ESO, 2016
1. Introduction
The Pleiades open cluster does not only offer us a beautiful spectacle during the fall, it is one of the best-studied stellar associations and one of the cornerstones to understand stellar properties and evolution. In fact, the literature includes more than one thousand refereed papers dealing with the Pleiades, most of which use the Pleiades as a reference, just in the last ten years. In spite of this, the Pleiades cluster still has many secret and basic parameters, such as its distance and age, that are not clearly established. Even the census of this cluster is incomplete, although the recent works by Stauffer et al. (2007), Lodieu et al. (2012), and Bouy et al. (2013) have considerably improved the membership list, In fact, Bouy et al. (2015) has increased the number of known members by 50% with public archival data, very accurate proper motions, and multiwavelength photometry (see additional details in Sarro et al. 2014). Regarding its distance, there are currently two different methodologies based on parallaxes from Hipparcos (Perryman et al. 1997) and isochrone fitting, respectively. Pre-Hipparcos distances for the Pleiades range between 125 and 130 pc (see, for instance, Soderblom et al. 1993d), whereas the initial distance derived by Hipparcos is much closer, about 119 pc (van Leeuwen 1999). This last value is significantly different from the distance derived by Pinsonneault et al. (1998), who used color-magnitude diagrams and fitting isochrones and obtained 133.5 ± 1.2 pc. More recently, van Leeuwen (2009), by reanalyzing Hipparcos data, derived a distance of 120.2 ± 1.9 pc. These values should correspond to the distance to the cluster center, whose core radius should be around 3 degrees, which corresponds to 5–6 pc. Another trigonometric parallax, based on Hubble Space Telescope data and three members, was found by Soderblom et al. (2005), who obtained 134.6 ± 3.1 pc. Recently, Melis et al. (2014) derived a distance of 136.2 ± 1.2 pc based on an accurate parallax for four bona fide members obtained with the VLBI. This value also agrees with that derived by Galli et al. (in prep.) using accurate proper motions and the convergence point method (137.7 ± 2.5 pc).
The evolution of lithium, either from the cosmological or from the stellar perspective, has received a significant amount of attention since it gives us access to the early universe, the late evolution of stars, or their internal structure. In this last case, since its abundance depends on stellar age (Herbig 1965), lithium has been used as an evolutionary tracker. However, we are far from understanding all sides of the lithium problem.
For FGK members belonging to open clusters there is a clear dependence of the lithium abundance with mass, age, and other parameters such as rotation or activity. Standard models predict that the depletion happens during the pre-main-sequence evolution. However, the observations show that the depletion continues beyond the arrival to the ZAMS, so additional, nonstandard mixing has to take place. Moreover, there is a narrow effective temperature range (6400–6900 K) for clusters that are older than the Pleiades, which shows a large depletion of lithium abundance due to nonstandard mixing, the so-called lithium gap, dip, or chasm (Boesgaard & Tripicco 1986a; Michaud & Charbonneau 1991; Balachandran 1995). In any case, the complexity of the evolution has been established by multiple studies focusing on clusters of different ages. There are many seminal papers on this subject, for example, Pilachowski et al. (1984, 1987, 1988), Pilachowski (1986), Pasquini et al. (1997, and 2008) for NGC 7789, the Pleiades, NGC 752, and M67; Boesgaard & Tripicco (1986b), Boesgaard (1987b,a), Boesgaard et al. (1988), Boesgaard & Budge (1988, 1989), Thorburn et al. (1993), and Barrado y Navascues & Stauffer (1996) for the Hyades, Coma, the Pleiades and Alpha Per, and Praesepe; Soderblom et al. (1993a,b,c) for Praesepe, the Pleiades and Ursa Majoris moving group. More recently, additional observations for generally younger clusters have been studied. For example, to provide some references, NGC 2516 and M35, almost Pleiades twins (Jeffries et al. 1998; Barrado y Navascués et al. 2001a), IC 2602 and IC 2391 (Barrado y Navascués et al. 1999, 2004; Randich 2001; Randich et al. 2001) NGC 2547 (Jeffries et al. 2003), IC 4665 (Jeffries et al. 2009), and Collinder 69 (Dolan & Mathieu 1999; Bayo et al. 2012). In the very near future, the large-scale spectroscopic survey Gaia-ESO (Gilmore et al. 2012; Randich et al. 2013) will provide an extended database. A recent example is the case of the Vela OB2 association (Sacco et al. 2015).
Lately, several works have been published trying to understand the lithium content in solar-type stars from different perspectives. Bouvier (2008), see also Eggenberger et al. (2012), investigated the effect of the disk lifetime on the rotation and lithium; these authors found that slow rotation would be the consequence of long-lasting, star-disk interaction during the PMS and would produce a significant decoupling between the core and convective envelope with the final consequence of extra mixing and higher lithium depletion. The analysis by Bouvier et al. (2016) of the Gaia-ESO data corresponding to 5 Myr old cluster NGC 2264 shows a lithium enhancement for fast rotators with effective temperature in the range 3800–4400 K. On the other hand, Somers & Pinsonneault (2014) argued that the strong magnetic field in fast rotators during the early PMS enlarges the radii and diminishes the temperature of the bottom of the convective envelope, provoking overabundances. The effective temperature would also be affected owing to the larger spot coverage (with cooler temperatures). These investigations assume that the lithium spread for a given mass corresponds to real abundance differences. In contrast, Stuik et al. (1997), Jeffries (1999), King et al. (2000), Barrado y Navascués et al. (2001b), King & Schuler (2004), and King et al. (2010), all focused on the Pleiades but with very different approaches, have tried to verify whether the real cause is related to the presence of surface inhomogeneities and their effect on the observed lithium equivalent width. Some of these works conclude that at least partially the spread is due to atmospheric effects; others argue that most come from real differences in the depletion rate during the PMS evolution. The debate is still open. Here, we reanalyze the complete data set using new membership probability and rotation periods and try to shed new light on lithium depletion in connection with rotation and stellar activity.
2. The data
2.1. Proper motions and photometry from DANCe and Tycho
The starting point of this analysis is the quasi-complete census of Pleiades members obtained by Bouy et al. (2015) within the DANCe project (Dynamical Analysis of Nearby Clusters; Bouy et al. 2013). The catalog was produced by essentially retrieving all the public data corresponding to large format detectors in the available open archives, and reprocessing and deriving new astrometric solutions, including the correction of distortions due to diverse instrumentation. The large temporal baseline of this amazing database and very accurate astrometry have been used to derived very precise proper motions for the initial sample of almost 2 000 000 objects.
Bouy et al. (2013) contains the first release of the DANCe-Pleiades catalog. The second release is described in detail in Bouy et al. (2015). Briefly, the main improvements with respect to the first consists of the addition of AAVSO Photometric All-Sky Survey DR7 (APASS) gri photometry and the analysis of the Tycho-2 catalog (Høg et al. 2000), since some Pleiades members are too bright for DANCe. The Tycho-2 photometry was complemented with APASS, 2MASS, and CMC-14 photometry, and the selection method described in Sarro et al. (2014) was applied to the merged catalog within the same area as the DANCe-Pleiades survey. A total of 207 high probability, bright members were identified, nicely complementing the DANCe-Pleiades catalog at the bright end of the luminosity function.
Both proper motions and multiwavelength photometry fed a robust method based on statistic probabilities and we extracted the probable members with probabilities larger than 75%. This probability (PrAll, our cutoff for membership) was derived using the position in several color-magnitude diagrams and proper motions. Details can be found in Sarro et al. (2014). The Pleiades list includes 2109 stellar and substellar members and it has a comprehensive and homogeneous photometry in the Sloan and 2MASS filters.
When there is an overlap between Tycho and DANCe, we preferred the Tycho proper motions (to directly compare with previous works) and membership probabilities to DANCe results when plotting the data, when both data sets were available.
2.2. Lithium from the literature
We collected all the available data in the literature regarding lithium equivalent width − W(Li) – in members of the Pleiades cluster. Namely, we searched in the following studies: Soderblom et al. (1993b), Garcia Lopez et al. (1994), Marcy et al. (1994), Basri et al. (1996), Jones et al. (1996), Rebolo et al. (1996), Oppenheimer et al. (1997), Martín et al. (1998, 2000), Stauffer et al. (1998a), Jeffries (1999), Pinfield et al. (2003), Margheim (2007), King et al. (2010), and Dahm (2015). Previous works do not add additional stars to this compilation and have large uncertainties in their lithium equivalent widths.
In total, our compilation includes 210 objects, reaching around the substellar borderline at 0.072 M⊙, and some of these objects have up to six individual lithium equivalent width measurements, totalling 398 data points. We call this collection of 210 stars the Pleiades lithium sample. There is a gap where no observations have been executed between late-K and mid-M spectral types. Thus, W(Li) data are not available in the literature since no lithium is expected in this spectral range, approximately Teff = 4000–3000 K, because this element is rapidly exhausted in PMS low-mass stars.
The data are listed in Table 1, which gives all the lithium equivalent widths for the complete data sample; Table 2, which gives proper motions and membership probabilities (see Sect. 2.3); and Table 3, which gives ancillary data, including effective temperatures, luminosities, final lithium equivalent widths and abundances, and other data (see Sects. 3.2 and 4). For these last two tables, we only list the subset corresponding to bona fide single stars (additional information in Sect. 4.3).
2.3. Additional ancillary data from the literature and the Virtual Observatory
For the sake of completeness, the Pleiades lithium sample also includes additional data from the literature, namely spectral types, rotational periods, and additional photometry in the Johnson and Cousins systems. The photometry comes from the Open Clusters database by Charles Prosser and John Stauffer, which is a careful compilation of the available data acquired during the 20th century. Table 1 from Stauffer et al. (2007) describes the original photometric catalogs, the name prefix used in each of them, the photometric bands, and magnitude range for each of them.
We compiled a secondary sample for completeness and comparison purposes, based on Hertzsprung (1947), Haro et al. (1982), Hambly et al. (1993), and Pinfield et al. (2000), which corresponds to the Pleiades candidate members with prefix HII, HCG, HHJ, and BPL, respectively. After removing the duplications, we have 1131 objects. Then, this sample from the literature was cross-matched with the DANCe and Tycho catalogs to have homogeneous photometry in the Sloan system and membership probabilities (as derived in Sarro et al. 2014). We retained only those candidate members whose membership probability is larger or equal to 0.75 (as recommended in Sarro et al. 2014) and the sample includes 810 probable Pleiades members. The sample is called the Pleiades comparison sample.
In addition to the DANCe deep photometry (see Sect. 2.1) and the ancillary data from the literature, we added public photometry using the Virtual Observatory, taking advantage of the Virtual Observatory Sed Analyzer tool (VOSA; Bayo et al. 2008, 2016). The VOSA tool was designed to perform the following tasks: digest photometric data supplied by the user, search several photometric catalogs and theoretical models accessible through VO services, fit all the data to the models, compute the effective temperature and bolometric luminosity, and provide an estimation of the mass and age of each source. In particular, VOSA explores the WISE (Cutri & et al. 2012), UKIDSS cluster (DR8; Adelman-McCarthy & et al. 2011), GALEX (Bianchi et al. 2011), and 2MASS (Cutri et al. 2003; Skrutskie et al. 2006) archives. In the case of UKIDSS, the data were trimmed by selecting those magnitudes fainter than 13.5 (all ZYJHK ≤ 13.5 mag) to avoid nonlinearity. Spitzer/IRAC data from Stauffer et al. (2007) were also added.
3. Membership
3.1. Proper motions and membership probabilities
In Bouy et al. (2013), we presented the DANCe survey of the Pleiades and its new photometric and astrometric catalog of the cluster reaching an unprecedented accuracy of <1 mas/yr reaching i ~ 24.5 mag, i.e., almost 4 mag beyond G = 20 mag, which is the limit provided by the Gaia mission (Prusti et al., in prep.). For the purposes of this paper, we define a star as a member of the Pleiades if the probability of membership derived in Bouy et al. (2013) is larger than 75%.
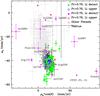 |
Fig. 1 Proper motions for Pleiades and Taurus-Auriga members. We distinguished four cases: green solid circles for lithium detection and membership probability larger than 0.75; blue open circles for lithium upper limits and membership probability larger than 0.75; magenta solid circles for lithium detection and membership probability less than 0.75; red open circles for lithium upper limits and membership probability less than 0.75. Membership probabilities come from Bouy et al. (2015). Light gray plus symbols are used for Taurus-Auriga members (taken from Ducourant et al. 2005). |
Pleiades DANCe proper motions (Bouy et al. 2013) are illustrated in Fig. 1, where we have also included Taurus members based on their proper motions from Ducourant et al. (2005). We note the box framing the vast majority of the Taurus members and the distinct Pleiades population. However, the transition between the loci of both groups is smooth and some bona fide Pleiades members lie within the Taurus locus. As a matter of fact, there are several Pleiades candidates with low membership probability (defined as PrAll ≤ 0.75) and detected lithium, some of which are located far away from the Pleiades median proper motion. This subsample is discussed in Sect. 3.3.
A few lithium-rich probable members also have proper motion with significant differences from the average. However, the error bars are large and all the photometric information suggests that they might be members.
3.2. The Herzprung-Russell diagram
We took advantage of VOSA (Bayo et al. 2008, 2016) to derive basic properties of our samples (the lithium and comparison samples).
We derived the bolometric luminosity and effective temperature for each objec using two sets of theoretical models: Kurucz (Castelli et al. 1997), any value of Teff; and BT-Settl, Teff ≤ 4400 K, by the Lyon group (Allard et al. 2012). We restricted our computation to log g = 4.5, valid for the Pleiades age, and solar metallicity. Regarding the distance, we selected 133 pc (Pinsonneault et al. 1998) with a margin of 5 pc. We explored a different value for the distance (120.2 ± 1.9 pc; van Leeuwen 2009) and its results are discussed below. The non-Hipparcos values derived by trigonometric parallaxes by Soderblom et al. (2005) or Melis et al. (2014), which are 134.6 ± 3.1 and 136.2 ± 1.2 pc, respectively, are essentially the same as the value we used. The reddening was fixed at Av = 0.12 mag. However, there are a dozen of Pleiades members, located south of Merope, that have a larger reddening. In any case, since the reddening vector goes parallel to the MS and these few members do not show any special signature (high or low lithium content, activity), we did not take this issue into account. Possible blue excesses were avoided, since neither near UV nor u photometry were not included in the fit. Then, we fitted a third degree polynomial to the best models, minimizing the χ2. Thus, we derive the optimal Teff and avoid the discrete values returned by VOSA.
Our derived effective temperatures were compared with values published in the literature and with values derived using colors and there are not obvious differences, although slow rotators (Sect. 4.3) tend to have lower Teff when derived with VOSA, and fast rotators show the opposite behavior. In any case, these differences are about 100 K within the uncertainties of the grid of models used by VOSA.
Regarding the accuracy of the bolometric luminosities derived with VOSA, all objects have enough data points in their SED to cover at least 25% of the total bolometric flux (i.e., the ratio between the measured fluxes and the derived total flux, and the rest are estimated with the theoretical model). More than 70% of the Pleiades sample with measured lithium has a ratio of measured flux to total flux that is larger than 50%. Thus, we can conclude that both effective temperature and bolometric luminosity are very well characterized. This methodology does not use any estimate from bolometric corrections or a color, which might be strongly biased. Individual colors might be affected by different phenomenology, such as activity and variability and, in any case, color indices cover a reduced wavelength range and a small fraction of the total luminosity; these indices are subject to a much larger uncertainty than our methodology, which includes all available photometry and a very large range in wavelength coverage.
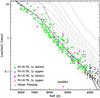 |
Fig. 2 Hertzsprung-Russell diagrams showing Pleiades data. The isochrones correspond to Siess et al. (2000), 1, 3, 5, 7, 10, 15, 20, 30, 50, 125 Myr, and 5 Gyr; BT-Settl by the Lyon group (Allard et al. 2012), 1, 20, 120 Myr, and 10 Gyr. The 120/125 Myr isochrones are highlighted. Symbols as in Fig. 1. |
Our results are shown in Fig. 2, representing a HR diagram (symbols as in Fig. 1, but in this case only Pleiades data have been included). Two isochrone sets by Siess et al. (2000) and Chabrier et al. (2000) are also shown. Cluster members follow the 125 Myr isochrone (essentially the ZAMS for the spectral types F, G, and K), but the width of the cluster sequence is much larger than the corresponding value owing to the binary sequence; an offset between the data and the Siess et al. (2000) 125 Myr isochrone is relevant. This is also the lithium depletion boundary age of the cluster (Stauffer et al. 1998b). This fact might be related to the distance we used (133 pc) to the model itself or to the way VOSA fits the effective temperature. However, the proper fitting demands a distance around 115 pc, which is a value that is even lower than the Hipparcos estimate. Thus, the feature seems to be real and reveals a problem with the models and/or with the effect of second order parameters, such as activity or magnetic fields. Another possible explanation is the known, but not completely explained blue excesses for Pleiades members. Stauffer et al. (2003) concludes that the color anomaly, for K members and using color-magnitude diagrams, based on spottiness is due to fast rotation and activity. In our sample, the underluminosity with respect to the ZAMS also appears for a significant number of F and G stars. As discussed in Sect. 4.3, the effect should be the opposite in an HR diagram: activity and the presence of surface inhomogeneities should shift fast rotators toward cooler temperatures (Jackson & Jeffries 2013). Somers & Pinsonneault (2014; and references there) proposed inflated radii due to rotation and strong magnetic fields. For fainter, cooler members the BT-Settl 120 Myr isochrone describes very well the locus for single members. Somers & Pinsonneault (2015) achieved similar results by focusing on the Pleiades.
One object stands out in the HR diagram: HII 2281. It has an anomalous proper motion (Fig. 1 and Hertzsprung 1947) and it should be demoted and rejected as a Pleiades member despite its detected lithium (it was already rejected by Hertzsprung 1947). In any event, this lithium-rich star deserves further study.
3.3. Properties of low-probable members with detected lithium
There are a fair number of Pleiades members (18, not including PPL-1), as defined in the literature, with a low probability of being members based on DANCe and that have lithium detections. Most of these members have proper motions far away from the cluster median (Fig. 1, magenta solid circles). Some of them have very large errors, but in any case, they seem to be interlopers, and in few cases they might belong to a loose Taurus population, in similar fashion to what can be found in Orion (Alves & Bouy 2012; Bouy et al. 2014).
As a matter of fact, we can distinguish four different groups among these possible interlopers, depending on the position on the proper motion diagram (Fig. 1), the errors, and the photometry: the Pleiades candidates with proper motions similar to Taurus and small errors (HII 2281 and HII 0885); a similar group with large error bars (HII 2984, Pels 173, and Pels 112); another with problematic photometry and proper motions compatible with Pleiades membership (HII 0248, HII 0303, HII 0738, HII 1275, HII 1912, HII 2908, HII 3197, Pels 41, and HCG 509); and the few objects with very different movement (HII 0697, HCG 131, Pels 43, and CFHT-PL-15). The first two groups might belong to the spread Taurus-like population, which is probably several million years old or to the so-called Local Association (the Pleiades supercluster, Eggen 1975, and 1995), a collection of young stars with similar kinematic properties that are not necessarily coeval; they might be grouped by gravitational resonances of the galactic potential. This situation, which is possibly related to the Local Association, might happen for the last group.
Regarding the nine objects with problematic photometry, several might be binary or multiple systems (HII 0303, HII 0738, HII 3197, and HCG 509) because of their position in the HR diagram (Fig. 2). In addition, HCG 509 and HII 3197 have membership probabilities of 0.16 and 0.71, respectively, and even in the case of HCG 509, a Li-rich mid-M (Oppenheimer et al. 1997), non-membership is not assured. The other five stars (HII 0248, HII 1275, HII 1912, HII 2908, and Pels 41) have membership probability between 0.55 and 0.72 and they should be considered as bona fide members.
In any case, we can conclude that the 0.75 membership threshold is the best compromise between completeness and contamination, but considering the strongly bimodality of the distribution of membership probability (a huge peak at 0% and another around 90%) one can say that p = 50% is almost certainly a member, and p = 15% is also most certainly a nonmember.
4. Lithium in members of the Pleiades
4.1. Building a clean a lithium sample for the Pleiades
We created an homogeneous sample (at least as much as possible) of bona fide Pleiades members to revisit the lithium problem. First, we only selected those with membership probabilities that are larger than 0.75 (see Sect. 3.3). Then, for those with several measured W(Li), we selected only one value among our complete data set of published W(Li). To do so, we followed two different approaches: the primary, selection A, is based on the spectral resolution, whereas the secondary, selection B, essentially depends on the signal-to-noise ratio (S/N).
In the first case, the rationale responds to the clear separation from the lithium feature at 6707.8 Å of the contaminant iron line at 6707.4 Å, i.e., both can be measured. We prioritized the data sets as follows: King et al. (2010), R ~ 60 000 with a 9.2 m telescope; Jones et al. (1996), R ~ 45 000 with a 10 m telescope; Oppenheimer et al. (1997), same as previous; Soderblom et al. (1993b), R ~ 50 000 with a 3 m telescope; Margheim (2007), R ~ 12 800 with a 3.5 m telescope with multiplexing; Jeffries (1999), R ~ 14 500 with a 2.5 m telescope; and Garcia Lopez et al. (1994), R ~ 10 000 with a 4.2 m telescope. For selection B, the achieved S/N is paramount, therefore, we preferred that the data come from spectra acquired with 10 m telescopes or 4 m class telescopes with large multiplexing (i.e., large exposure times) over conventional instruments (long slit, echelle spectrographs) on 4 m, 3 m or 2 m class telescopes. In this case we followed the hierarchy of King et al. (2010), Margheim (2007), Jones et al. (1996), Jeffries (1999), Oppenheimer et al. (1997), Garcia Lopez et al. (1994), and Soderblom et al. (1993b). Thus, we selected the values with the smallest individual errors in W(Li), while preserving some homogeneity in the data set.
The most significant difference between both selections, owing to sample sizes, corresponds to values from Margheim (2007) and Soderblom et al. (1993b). The first work compared both data sets and derived a systematic difference with a mean value of 12 mÅ, with the most recent, which was taken at higher S/N and lower spectral resolution, being higher. This W(Li) offset does not depend on the specific value and is essentially constant for all equivalent widths. Margheim (2007) ascribed this difference to a lower continuum for low S/N spectra, although the net effect of spectra taking at significant resolution is to decrease the measured equivalent width. However, Margheim (2007) supports his conclusion with a comparison between abundances derived with equivalent widths and with spectral synthesis.
Regardless of the offsets in the individual sources of lithium equivalent widths, our analysis was carried out in parallel with both selections and we did not find any significant difference. All values are listed in Table 3.
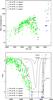 |
Fig. 3 Lithium equivalent width (top) and lithium abundance (bottom) vs. effective temperature. The diagram shows all relevant data, including multiple measurements for the same stars and known binaries. The symbols are as follows: green solid circles indicate lithium detection and membership probability larger than 0.75; blue open triangles indicate lithium upper limits and membership probability larger than 0.75; magenta solid circles indicate lithium detection and membership probability less than 0.75; and red open triangles indicate lithium upper limits and membership probability less than 0.75. Membership probabilities come from Bouy et al. (2015). The curves correspond to BT-Settl models from Allard et al. (2012). The central dips denote 10 and 20 Myr, the blue side of the lithium abyss includes values for 50 and 125 Myr, and the red side shows the computation for 50, 90, 125, and 150 Myr. |
4.2. Lithium in FGK members
The top panel of Fig. 3 shows the lithium equivalent width versus the effective temperature. We have not plotted the errors in W(Li) for clarity, but they are not large in most of the cases (see Table 3). The large spread for a given temperature is quite obvious, as is the dramatic drop after Teff = 4400 K and the location of the LDB at 2800 K (the blue and red sides of the lithium abyss, respectively).
We derived the lithium abundances, defined as A(Li) = 12 + log (Li/H), using curves of growth by Soderblom et al. (1993b). For objects with an effective temperature that is cooler than 4000 K (the coolest of the curves from Soderblom et al. 1993b), we assumed this temperature and derived an abundance just as a reference. We avoided the mixing of several sets of curves of growth because, for very low temperatures, they produce very different values (see, for instance, the comparison between Palla et al. 2007 and Pavlenko & Magazzu 1996). In any case, this assumption does not affect our discussion, since most of the object below 4000 K have lithium upper limits and those with actual detections have Teff ≤ 2600 and should have a cosmic, undepleted abundance (i.e., A(Li) = 3.1–3.2).
In order to estimate the errors in the abundance, we took into account the original errors in W(Li), as taken from the literature, and the estimated errors for the Teff fit by bootstrapping their values inside their uncertainties.
The results are shown in the bottom panel of Fig. 3. The diagram also includes the theoretical lithium depletion computed in the BT-Settl models (50, 90, 125, and 150 Myr). As can be seen, the models reproduce the location of the LDB very well, but since they do not include all the complex effects for F, G and K stars, they are only indicative for the blue side.
The lithium spread for stars with the same temperature is very evident for any spectral type, but it is even more conspicuous for Teff = 5200–4000 K. In fact, there is a relation with the bolometric luminosities: the higher the W(Li), the higher the bolometric luminosity; this relation might be related to binarity (see the case of the Hyades, Barrado y Navascues & Stauffer 1996) and/or rotation. This is examined in greater detail in Sect. 4.4.
Some stars with high lithium abundance and Teff around 4500 K have low membership probability. They tend to have larger luminosities and some of them might be pollutants (see Sect. 3.3).
The Pleiades members confirmed by DANCe with a G-K spectral type have lithium abundances corresponding, grosso modo, to the expected values for their age, even taking the lithium spread for the same Teff into account. This fact does not agree with the models of Baraffe & Chabrier (2010), where they predict that episodic accretion events during the PMS could produce ZAMS age GK stars that are severely depleted in lithium, hence, calling into question the use of lithium as a membership indicator in young clusters like the Pleiades. A similar investigation by Sergison et al. (2013) has not found this effect either.
As stated before, the lithium depletion pattern has received a significant amount of attention both from the theoretical and observational points of view. Very recently, Somers & Pinsonneault (2014) linked the effect of inflated radii from rotation and strong magnetic fields with lithium depletion. Earlier, Bouvier (2008) postulated that the basic reason was different disk lifetime for fast and slow rotators, the rotation evolution, and extra lithium mixing due to the shear at the bottom of the convective zone. However, it is not clear that such models can explain the full range in lithium seen in the Pleiades; Eggenberger et al. (2012) developed the disk lifetime concept further for a 1 M⊙ model and predicted a maximum of 0.25 dex change in abundance that is totally insufficient. The lack of depletion for 0.9 M⊙ at 5000 K for some Pleiades members, normally fast rotators, is unexplained by any model, and in any case, regarding the results by Somers & Pinsonneault (2014), the lithium-rotation connection cannot be reproduced by their scenario, since essentially all very young PMS stars are in a saturated activity regime, and there is thus no activity (hence radius inflation) – rotation connection (see the case of h Per, Argiroffi et al. 2013).
4.3. Binarity and rotation: an effect on the HRD location?
The evolution of the lithium abundance in a star is affected by rotation. Binarity might play a role too. This fact is very relevant in the case of tidally locked binary systems (with Prot ≤ 15 days), as shown in chromospherically active binaries (Barrado y Navascues et al. 1997), Hyades (Barrado y Navascues & Stauffer 1996), or Praesepe members (King & Hiltgen 1996). Several works have searched for binaries in the Pleiades (Mermilliod et al. 1992; Rosvick et al. 1992; Bouvier et al. 1997b; Queloz et al. 1998) and we identified these binaries in our sample. However, some unaccounted for binary and multiple systems might be present too. In order to detect them, we investigated the position of our sample of G and K Pleiades in an HR diagram. We highlighted known visual and spectroscopic binaries with large black circles in Fig. 4. These binaries tend to be brighter than single stars for the same effective temperature, although there are a significant number of bright, “single” stars (indicated with a broken large black circle in the diagram). Therefore, we classified these as “suspected” binaries. The possible relation between rotation and lithium spread, including binaries, is investigated in Sect. 4.4.
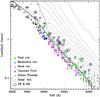 |
Fig. 4 Zoom for the Hertzsprung-Russell diagram showing Pleiades FGK members. The isochrones correspond to Siess et al. (2000), with ages of 1, 3, 5, 7, 10, 15, 20, 30, 50, 125, Myr, and 5 Gyr. The 125 Myr isochrone is highlighted. Fast (green solid circles), moderate (open blue squares), and slow (open magenta triangles) rotators are defined by their location within the period vs. luminosity plot shown in Fig. 5. The same symbols and color codes are used in the following figures. Empty large black circles indicate binaries (broken lines for suspected binaries). |
Regarding rotation, we cross-correlated our data with the rotational periods derived by Hartman et al. (2010), and we classified our sample of lithium members in fast, moderate, and slow rotators based on its distribution for different bolometric luminosities (see Fig. 5) or effective temperatures; these results are essentially the same. Although our criteria are somehow arbitrary (the borderlines between groups, see the discussion by Bouvier et al. 1997a regarding the rotation dichotomy and the link with circumstellar disks), they do not affect the general conclusions. However, that rotational periods are not always accurate. As a matter of fact, the comparison between the values from Hartman et al. (2010) and preliminary estimates from Kepler K2 (Howell et al. 2014) indicates that II 1095 belongs to the slow rotation group.
It is worth noting that known binaries tend to rotate slower than single stars (again from Fig. 5), at least for solar-type stars, where the statistics are more robust. The explanation might be due to the synchronization effect: a fraction of the Pleiades binaries would have orbital periods between 2 and 7 days, forcing the rotation period to be equal to the orbital period and larger than the corresponding value for single, fast rotators with the same luminosity. However, there is a bias for finding slowly rotating spectroscopic binaries, since short period binaries can be confused with rapid rotators due to the blending of the lines.
Moreover, the symbol code used in Fig. 4 also includes information regarding rotation. An interesting effect might take place: single stars with fast rotation might be, on average, brighter or cooler than other slower single members. However, the effect is far from proven and a color-magnitude diagram shows that single, fast rotating stars fall on top of the slower stars (Stauffer & Hartmann 1987). Lately, Jackson & Jeffries (2013) and Jackson & Jeffries (2014) investigated this issue and concluded that active pre-main-sequence stars have an expanded radius due to the presence of spots, slowing down the descent along the Hayashi tracks, although they cannot rule out that the strong magnetic fields are inhibiting the convective flux transport. Somers & Pinsonneault (2014) predict larger radii (and cooler temperatures) for fast rotators. A different evolutionary history for fast rotators should have an effect on the lithium content, which would be maintained over the whole stellar time span. However, the spread for single Hyades stars at about 600 Myr is much smaller than the observed range for the Pleiades. If the effect is real, our interpretation is that the fast rotators appear cooler owing to activity, and the overall bolometric luminosity, which is a quantity that depends on the nuclear reaction in the stellar core, remains essentially unaffected. A significant fraction of their surface should be covered with solar-like spots with lower temperatures, and the spectral energy distribution should be affected by the presence of the spot, shifting the distribution to the red and keeping the total energy output. To compute Lum(bol) or Teff, we do not rely on bolometric corrections and colors, which can be affected by activity and the presence of surface inhomogeneities. However, we cannot completely discard the other effect discussed above or changes on the stellar structure due to rotation and centrifugal forces. Color effects due to rotation and activity are studied in depth in a future work.
4.4. The lithium spread for G and K stars: rotation versus activity
The lithium spread, especially for K stars, has been discussed by Soderblom et al. (1993b), and extensively examined in the literature for the Pleiades (Garcia Lopez et al. 1994; Jones et al. 1996; Oppenheimer et al. 1997; Jeffries 1999; and King et al. 2010) and for other clusters such as NGC 2451 (Hünsch et al. 2004). For more details, see the introduction.
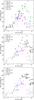 |
Fig. 6 Lithium equivalent vs. bolometric luminosity for the high probable members (probability larger than 0.75). For those stars with multiple values of W(Li), only our selection is represented (see text). Top: binaries and suspected binaries are included and highlighted with large open circles. Middle and bottom: only single stars are shown. Lithium-rich stars are indicated with large, open diamonds. In the first case, selection B, we used the W(Li) selection based on the S/N, whereas in the second panel, selection A, we show the data based on spectral resolution. |
That lithium equivalent widths for young stars are enhanced for rapidly rotating and active K dwarfs is a well-established fact, but there is still no universally accepted physical explanation nor agreement as to whether the observed effect is due to differences in lithium abundance or instead is a consequence of differing line formation processes. We already discussed the relation of lithium with activity via surface inhomogeneities in Barrado y Navascués et al. (2001b), and compared this relation with other lines produced by alkali elements such as sodium and potassium, which are not depleted in the stellar interior. We concluded that, at least partially, the change in effective temperature, which is lower when compared with the spotless photosphere, should produce an increase in the observed lithium equivalent width for the same abundance. A similar conclusion was derived by Randich (2001), at least for stars that are warmer than ~5400 K: activity modifies the potassium equivalent widths and, thus, the inferred potassium abundances (but see also the study of stars in the Alpha Per cluster by Martín et al. 2005).
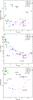 |
Fig. 7 Photometric variability in the r band (top). The projected equatorial velocity (middle) and the fraction between the Lx and bolometric luminosities (bottom) vs. the rotational period. Only single stars are shown. The lithium-rich stars come from selection A, based on spectral resolution, although the result is practically identical if the stress is put on the S/N. HII 380 and HII 740 do not have a measured value of Lx, and HII 708 does not have a measured value of the photometric amplitude, and therefore they are not represented on some of these diagrams. |
Figure 6 shows our selected values of lithium equivalent width versus the bolometric luminosity to avoid the possible effect by the activity/spotness on the effective temperature. The top panel includes single, known, and suspected binaries, whereas, for the sake of simplicity, the bottom panel only shows single stars. Colors and symbols differentiate the three classes of rotators (see Fig. 5). The data for single stars appear in Table 2 and Table 3. The relation between the equivalent width and the rotation for single stars, for the same luminosity, is quite striking, especially for Lum(bol) = 0.5–0.2L⊙ (about K2–K7 spectral types or 0.75–0.95 M⊙), but even reaching 1.0 L⊙ (about G5 or 1.1 M⊙). Stars with very large lithium equivalent width are indicated with big open diamonds and will be discussed in some detail below. In the case of binaries, fast rotating systems (or suspected binaries) have much larger equivalent widths than slow rotators. Is this a consequence of rotation per se? We note that HII 3096 and HII 380, the first having intermediate rotation rate and the last being a slow rotator, have lithium equivalent widths that are larger than the corresponding value for similar stars. We examine the activity effect on W(Li) via surface inhomogeneities to explain these anomalies.
Figure 7a shows the relation between the photometric variability (the amplitude of the light curve) and the rotational period. As expected, slow rotators have a reduced variability. On the contrary, fast rotators display a large range for the photometric amplitude. There are two explanations for this: either the spots might be distributed very evenly on the stellar surface or the inclination angle is large (near pole-on). Hence, a stellar spot or a group of spots are visible during a significant fraction of the period. Therefore, even if the spot filling factor is large, the photometric variability should be small. In fact, this is what seems to be happening for HII 1756, which is a fast rotator, and HII 1593, which is a slow rotator, as shown in Fig. 7b, where we show the vsini versus the rotational period. In any case, some might have genuine low activity that perhaps reassembles a solar minimum or even a Maunder minimum. We labeled several Pleiades members in the diagram. All four of these slow and moderate rotator with large variability and have large W(Li).
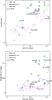 |
Fig. 8 Top: comparison of the X-ray and bolometric luminosities, taking the rotational periods into account. HII 380 and HII 740 do not have a measured value of Lx and therefore they are not represented on the diagram. Bottom: the amplitude of the light curve. Only single stars and the W(Li) based on the spectral resolution are shown in both panels. |
What about other signposts of activity? We compared the X-ray emission, i.e. the ratio between the X-ray and bolometric luminosities, with the rotational periods (Fig. 7c). As expected, the large majority of fast rotators (short Prot) have Lum LX/LBol near the saturation at a ratio close to −3. Most of these Pleiades members show, indeed, a lithium excess, even if the Prot is not remarkably short. In any case, the figures show a trend, not a clear-cut relationship.
In any event, just to verify whether the stellar mass might play a hidden role in the trends discussed above, Fig. 8a compares the ratio Lum LX/LBol with the bolometric luminosity (as a proxy of the stellar mass). Clearly, the lithium excesses are related to X-ray overluminosities: the connection between rotation-activity and lithium is striking, especially for the luminosity range 0.1–1 L⊙ (up to 1.1 M⊙ or G5 spectral type). However, the X-ray is coming from the corona and the lithium feature is formed at the photosphere. Thus, the optical variability should be a better indicator of the effect of activity on the observed lithium equivalent width. Therefore, as a cross-check, we used the amplitude of the light curve and compared this with the bolometric luminosity (Fig. 8b), which supports our interpretation.
Thus, although there is not a one-to-one relation between lithium overabundance and rotation and/or activity, we conclude that part of the origin of the observed lithium spread could be activity via surface inhomogeneities. This effect is partially hidden by other factors such as the spot filling factor, inclination of the rotation, and binarity, but the trend is significant. However, a much younger association, namely NGC 2264 shows a clear connection between rotation and lithium, which should be intrinsic and cannot be connected to activity, since this 5 Myr sample is saturated (see details in Bouvier et al. 2016). Thus, both factors should play a role, although the relative importance of these two effects could change at different ages.
4.5. The lithium-chronology: Lithium depletion pattern for slow and fast rotators
In order to derive an age estimate for single stars or a new moving group, it is quite common to compare their lithium equivalent widths with the lithium depletion pattern for several well-known open clusters and stellar associations at different evolutionary states. For a given mass/Teff/luminosity, however, the visual inspection indicates that there is a large spread in W(Li), and there are not clear boundaries between clusters of very different ages.
Since we have clearly established the relation between W(Li) and rotation, independent of the original reason, we propose to make this type of comparison, the lithium-chronology for G and K stars, taking the rotation class into account. A slow rotator should be compared solely with cluster members with large rotational periods and the same holds for fast rotators. Age estimates derived this way should have much smaller error bars.
4.6. Pre-main-sequence evolution: Lithium, rotation, radii, and planetary systems
There is a trend between planet host and lithium depletion for solar-like stars (Israelian et al. 2009), in the sense that stars with known planets are, on average, lithium-poor compared with similar stars. It has not been proven, however, that the relation is physical and there is still much work to be done. If real, the origin of this trend is not understood. On the other hand, there is evidence of planets being engulfed, or very close to it (Lillo-Box et al. 2014b,a), by their host star, leaving abundance abnormalities (Israelian et al. 2001), but the host stars would be enriched by metallic elements. If the trend is real, our interpretation is not related to contamination, but to the early evolution and connection between the circumstellar disk and rotation (and activity). Weak-line T Tauri stars (i.e., diskless) rotate faster than classical T Tauri stars (with circumstellar disks) because of the disk-locking produced by magnetic fields. The dichotomy for the rotation rates are kept as stars evolved toward the main sequence (Bouvier et al. 1997a). Once there, the slow rotators have a tendency to have a debris disk, the assumed remnant of planet formation, suggesting that they do have a planetary system (Bouvier 2008; McQuillan et al. 2013b,a). As we have seen, Pleiades members, which are already very near the ZAMS, show a clear correlation between rotation and lithium equivalent width. The cause can be either an early effect, which is an intrinsic effect due to rotation (as in the case of NGC 2264; Bouvier et al. 2016); inflated radii due to fast rotation producing a reduced lithium depletion (as postulated by Somers & Pinsonneault 2014, implying a different evolutionary history); or an apparent effect due to the rotation-activity connection, which is a cooler effective temperature and enhanced lithium equivalent width, without modifying the lithium abundance depletion pattern. Independent of the validity of these three scenarios, which are perhaps all at work, the distribution of rotational periods and lithium in Pleiades bona fide members suggest that the likelihood of finding planetary systems in slow rotators with lower W(Li), may be much larger than in the case of lithium-rich, fast rotators. Moreover, since the vsini and activity are small, from the technical point of view it would be easier to find these planets.
5. Conclusions
We have compiled all the available lithium equivalent within members of the Pleiades open cluster and reassessed the membership probability based on the DANCe database (Sarro et al. 2014; Bouy et al. 2015). In addition, we have compiled multiwavelength photometry from DANCe and from the literature based on the Virtual Observatory using capabilities of VOSA (Bayo et al. 2008) to derive accurate bolometric luminosities and effective temperatures. We gathered all the available information regarding rotational periods, projected equatorial velocities, binarity, and activity. Thus, we selected a subsample of Pleiades members based on their position on the Herzprung-Russell diagram and the membership probability as derived from proper motions and different photometric color-magnitude diagrams.
We have not found any undisputed trend between a star location in the HR diagram and the rotation. If there is, it might be connected with activity and the presence of large coverage by stellar spots, which should affect the derived effective temperature and/or the bolometric luminosity. However, the relation between the lithium equivalent width and rotation is much more evident, especially for single stars with the same luminosity in the range Lum(bol) = 0.5–0.2 L⊙ (about K2−K7 spectral types or 0.75–0.95 M⊙), but even reaching 1.0 L⊙ (about G5 or 1.1 M⊙). This lithium excess, which is connected to rotation (Butler et al. 1987; Soderblom et al. 1993b), also seems to be connected with activity (initially suggested by García López et al. 1991), either in terms of photospheric variability (the amplitude) and X-ray emission coming from the stellar corona. Thus, although we cannot find a bijective relation either between lithium excess and rotation or activity in the sense that stars with lithium excess are always very active and rotate fast and vice versa, it seems that part of the explanation falls on the last factor: surface inhomogeneities would modify the observed lithium equivalent. Moreover, since a bona fide lithium enhancement is present in young, fast rotators (as the case of NGC 2264 illustrates), both activity and rotation should play a role in the lithium problem. In addition, we suggest that because of the bi- or multimodal distribution of the rotational periods for a given mass, the gyrochronology should take this fact into account.
Finally, it is possible to speculate that if there is a connection between lithium and the presence of planets in field stars, Pleiades members with low lithium and slow rotation might have a larger probability of harboring planetary systems.
In any case, the lithium surface abundance is a probe to the stellar interior and, despite quite sophisticated recent theoretical efforts, we do not understand its evolution. Therefore, it seems necessary to revisit the problem with new, homogeneous data taken with a large spectral resolution instrument at a very high S/N, coupled with a complete data set that includes rotation, activity, other alkali, and so on. Thus, we can only be expected to be able to provide a comprehensive and solve the problem by having all this information at hand.
Acknowledgments
This research has been funded by Spanish grant ESP2015-65712-C5-1-R, the French grant ANR-10-JCJC-0501 DESC, and the CNRS PICS project “Comprendre l’origine et les propriétés des étoiles jeunes”. H.B. is funded by the Spanish Ramón y Cajal fellowship program number RYC-2009-04497, whereas J.B. and E.M. acknowledge financial support from the grant ANR 2011 Blanc SIMI5-6 020 01 “Toupies: Towards understanding the spin evolution of stars”. We also acknowledge support from the Faculty of the European Space Astronomy Centre (ESAC). It makes use of VOSA, developed under the Spanish Virtual Observatory project supported from the Spanish MICINN through grant AyA2008-02156, and of the SIMBAD database, operated at CDS, Strasbourg, France. This work is based in part on data obtained as part of the UKIRT Infrared Deep Sky Survey; from the Wide-Field Infrared Survey Explorer, which is a joint project of the University of California, Los Angeles, and the Jet Propulsion Laboratory/California Institute of Technology, funded by the National Aeronautics and Space Administration; and data from the Two Micron All Sky Survey, which is a joint project of the University of Massachusetts and the Infrared Processing and Analysis Center/California Institute of Technology, funded by the National Aeronautics and Space Administration and the National Science Foundation. We greatly appreciate the comments and suggestions by the anonymous referee.
References
- Adelman-McCarthy, J. K., et al. 2011, VizieR Online Data Catalog, II/306 [Google Scholar]
- Allard, F., Homeier, D., Freytag, B., & Sharp, C. M. 2012, in EAS Pub. Ser., 57, eds. C. Reylé, C. Charbonnel, & M. Schultheis, 3 [Google Scholar]
- Alves, J., & Bouy, H. 2012, A&A, 547, A97 [NASA ADS] [CrossRef] [EDP Sciences] [Google Scholar]
- Argiroffi, C., Caramazza, M., Micela, G., Moraux, E., & Bouvier, J. 2013, Protostars and Planets VI, 89 [Google Scholar]
- Balachandran, S. 1995, ApJ, 446, 203 [NASA ADS] [CrossRef] [Google Scholar]
- Baraffe, I., & Chabrier, G. 2010, A&A, 521, A44 [NASA ADS] [CrossRef] [EDP Sciences] [Google Scholar]
- Barrado yNavascues, D., & Stauffer, J. R. 1996, A&A, 310, 879 [NASA ADS] [Google Scholar]
- Barrado y Navascues, D., Fernandez-Figueroa, M. J., Garcia Lopez, R. J., de Castro, E., & Cornide, M. 1997, A&A, 326, 780 [NASA ADS] [Google Scholar]
- Barrado y Navascués, D., Stauffer, J. R., & Patten, B. M. 1999, ApJ, 522, L53 [NASA ADS] [CrossRef] [Google Scholar]
- Barrado y Navascués, D., Deliyannis, C. P., & Stauffer, J. R. 2001a, ApJ, 549, 452 [NASA ADS] [CrossRef] [Google Scholar]
- Barrado y Navascués, D., García López, R. J., Severino, G., & Gomez, M. T. 2001b, A&A, 371, 652 [NASA ADS] [CrossRef] [EDP Sciences] [Google Scholar]
- Barrado y Navascués, D., Stauffer, J. R., & Jayawardhana, R. 2004, ApJ, 614, 386 [NASA ADS] [CrossRef] [Google Scholar]
- Basri, G., Marcy, G. W., & Graham, J. R. 1996, ApJ, 458, 600 [NASA ADS] [CrossRef] [Google Scholar]
- Bayo, A., Rodrigo, C., Barrado y Navascués, D., et al. 2008, A&A, 492, 277 [NASA ADS] [CrossRef] [EDP Sciences] [Google Scholar]
- Bayo, A., Barrado, D., Huélamo, N., et al. 2012, A&A, 547, A80 [NASA ADS] [CrossRef] [EDP Sciences] [Google Scholar]
- Bianchi, L., Herald, J., Efremova, B., et al. 2011, Ap&SS, 335, 161 [NASA ADS] [CrossRef] [Google Scholar]
- Boesgaard, A. M. 1987a, PASP, 99, 1067 [NASA ADS] [CrossRef] [Google Scholar]
- Boesgaard, A. M. 1987b, ApJ, 321, 967 [NASA ADS] [CrossRef] [Google Scholar]
- Boesgaard, A. M., & Budge, K. G. 1988, ApJ, 332, 410 [NASA ADS] [CrossRef] [Google Scholar]
- Boesgaard, A. M., & Budge, K. G. 1989, ApJ, 338, 875 [NASA ADS] [CrossRef] [Google Scholar]
- Boesgaard, A. M., & Tripicco, M. J. 1986a, ApJ, 303, 724 [NASA ADS] [CrossRef] [Google Scholar]
- Boesgaard, A. M., & Tripicco, M. J. 1986b, ApJ, 302, L49 [NASA ADS] [CrossRef] [Google Scholar]
- Boesgaard, A. M., Budge, K. G., & Ramsay, M. E. 1988, ApJ, 327, 389 [NASA ADS] [CrossRef] [Google Scholar]
- Bouvier, J. 2008, A&A, 489, L53 [NASA ADS] [CrossRef] [EDP Sciences] [Google Scholar]
- Bouvier, J., Forestini, M., & Allain, S. 1997a, A&A, 326, 1023 [NASA ADS] [Google Scholar]
- Bouvier, J., Rigaut, F., & Nadeau, D. 1997b, A&A, 323, 139 [NASA ADS] [Google Scholar]
- Bouvier, J., Lanzafame, A. C., Venuti, L., et al. 2016, A&A, 590, A78 [NASA ADS] [CrossRef] [EDP Sciences] [Google Scholar]
- Bouy, H., Bertin, E., Moraux, E., et al. 2013, A&A, 554, A101 [NASA ADS] [CrossRef] [EDP Sciences] [Google Scholar]
- Bouy, H., Alves, J., Bertin, E., Sarro, L. M., & Barrado, D. 2014, A&A, 564, A29 [NASA ADS] [CrossRef] [EDP Sciences] [Google Scholar]
- Bouy, H., Bertin, E., Sarro, L. M., et al. 2015, A&A, 577, A148 [NASA ADS] [CrossRef] [EDP Sciences] [Google Scholar]
- Butler, R. P., Marcy, G. W., Cohen, R. D., & Duncan, D. K. 1987, ApJ, 319, L19 [NASA ADS] [CrossRef] [Google Scholar]
- Castelli, F., Gratton, R. G., & Kurucz, R. L. 1997, A&A, 318, 841 [NASA ADS] [Google Scholar]
- Chabrier, G., Baraffe, I., Allard, F., & Hauschildt, P. 2000, ApJ, 542, 464 [NASA ADS] [CrossRef] [Google Scholar]
- Cutri, R. M., Skrutskie, M. F., van Dyk, S., et al. 2003, 2MASS All Sky Catalog of point sources, The IRSA 2MASS All-Sky Point Source Catalog, NASA/IPAC Infrared Science Archive, http://irsa.ipac.caltech.edu/applications/Gator/ [Google Scholar]
- Cutri, R. M., et al. 2012, VizieR Online Data Catalog, II/311 [Google Scholar]
- Dahm, S. E. 2015, ApJ, 813, 108 [NASA ADS] [CrossRef] [Google Scholar]
- Dolan, C. J., & Mathieu, R. D. 1999, AJ, 118, 2409 [NASA ADS] [CrossRef] [Google Scholar]
- Ducourant, C., Teixeira, R., Périé, J. P., et al. 2005, A&A, 438, 769 [NASA ADS] [CrossRef] [EDP Sciences] [Google Scholar]
- Eggen, O. J. 1975, PASP, 87, 37 [NASA ADS] [CrossRef] [Google Scholar]
- Eggen, O. J. 1995, AJ, 110, 1749 [NASA ADS] [CrossRef] [Google Scholar]
- Eggenberger, P., Haemmerlé, L., Meynet, G., & Maeder, A. 2012, A&A, 539, A70 [NASA ADS] [CrossRef] [EDP Sciences] [Google Scholar]
- García López, R. J., Rebolo, R., Beckman, J. E., & Magazzù, A. 1991, in The Sun and Cool Stars. Activity, Magnetism, Dynamos (Berlin: Springer Verlag), eds. I. Tuominen, D. Moss, & G. Rüdiger, IAU Colloq, 130, Lect. Notes Phys., 380, 443 [Google Scholar]
- Garcia Lopez, R. J., Rebolo, R., & Martin, E. L. 1994, A&A, 282, 518 [NASA ADS] [Google Scholar]
- Gilmore, G., Randich, S., Asplund, M., et al. 2012, The Messenger, 147, 25 [NASA ADS] [Google Scholar]
- Hambly, N. C., Hawkins, M. R. S., & Jameson, R. F. 1993, A&AS, 100, 607 [NASA ADS] [Google Scholar]
- Haro, G., Chavira, E., & Gonzalez, G. 1982, Boletin del Instituto de Tonantzintla, 3, 3 [NASA ADS] [Google Scholar]
- Hartman, J. D., Bakos, G. Á., Kovács, G., & Noyes, R. W. 2010, MNRAS, 408, 475 [NASA ADS] [CrossRef] [Google Scholar]
- Herbig, G. H. 1965, ApJ, 141, 588 [NASA ADS] [CrossRef] [Google Scholar]
- Hertzsprung, E. 1947, Annalen van de Sterrewacht te Leiden, 19, A1 [NASA ADS] [Google Scholar]
- Høg, E., Fabricius, C., Makarov, V. V., et al. 2000, A&A, 355, L27 [NASA ADS] [Google Scholar]
- Howell, S. B., Sobeck, C., Haas, M., et al. 2014, PASP, 126, 398 [NASA ADS] [CrossRef] [Google Scholar]
- Hünsch, M., Randich, S., Hempel, M., Weidner, C., & Schmitt, J. H. M. M. 2004, A&A, 418, 539 [NASA ADS] [CrossRef] [EDP Sciences] [Google Scholar]
- Israelian, G., Santos, N. C., Mayor, M., & Rebolo, R. 2001, Nature, 411, 163 [NASA ADS] [CrossRef] [PubMed] [Google Scholar]
- Israelian, G., Delgado Mena, E., Santos, N. C., et al. 2009, Nature, 462, 189 [NASA ADS] [CrossRef] [PubMed] [Google Scholar]
- Jackson, R. J., & Jeffries, R. D. 2013, MNRAS, 431, 1883 [NASA ADS] [CrossRef] [Google Scholar]
- Jackson, R. J., & Jeffries, R. D. 2014, MNRAS, 441, 2111 [NASA ADS] [CrossRef] [Google Scholar]
- Jeffries, R. D. 1999, MNRAS, 309, 189 [NASA ADS] [CrossRef] [Google Scholar]
- Jeffries, R. D., James, D. J., & Thurston, M. R. 1998, MNRAS, 300, 550 [NASA ADS] [CrossRef] [Google Scholar]
- Jeffries, R. D., Oliveira, J. M., Barrado y Navascués, D., & Stauffer, J. R. 2003, MNRAS, 343, 1271 [NASA ADS] [CrossRef] [MathSciNet] [Google Scholar]
- Jeffries, R. D., Jackson, R. J., James, D. J., & Cargile, P. A. 2009, MNRAS, 400, 317 [NASA ADS] [CrossRef] [Google Scholar]
- Jones, B. F., Fischer, D. A., & Stauffer, J. R. 1996, AJ, 112, 1562 [NASA ADS] [CrossRef] [Google Scholar]
- King, J. R., & Hiltgen, D. R. 1996, PASP, 108, 246 [NASA ADS] [CrossRef] [Google Scholar]
- King, J. R., & Schuler, S. C. 2004, AJ, 128, 2898 [NASA ADS] [CrossRef] [Google Scholar]
- King, J. R., Krishnamurthi, A., & Pinsonneault, M. H. 2000, AJ, 119, 859 [NASA ADS] [CrossRef] [Google Scholar]
- King, J. R., Schuler, S. C., Hobbs, L. M., & Pinsonneault, M. H. 2010, ApJ, 710, 1610 [NASA ADS] [CrossRef] [Google Scholar]
- Lillo-Box, J., Barrado, D., Henning, T., et al. 2014a, A&A, 568, L1 [NASA ADS] [CrossRef] [EDP Sciences] [Google Scholar]
- Lillo-Box, J., Barrado, D., Moya, A., et al. 2014b, A&A, 562, A109 [NASA ADS] [CrossRef] [EDP Sciences] [Google Scholar]
- Lodieu, N., Deacon, N. R., & Hambly, N. C. 2012, MNRAS, 422, 1495 [NASA ADS] [CrossRef] [Google Scholar]
- Marcy, G. W., Basri, G., & Graham, J. R. 1994, ApJ, 428, L57 [NASA ADS] [CrossRef] [Google Scholar]
- Margheim, S. J. 2007, Ph.D. Thesis, Indiana University [Google Scholar]
- Martin, E. L., Basri, G., Gallegos, J. E., et al. 1998, ApJ, 499, L61 [NASA ADS] [CrossRef] [Google Scholar]
- Martín, E. L., Brandner, W., Bouvier, J., et al. 2000, ApJ, 543, 299 [NASA ADS] [CrossRef] [Google Scholar]
- Martín, E. L., Magazzù, A., García López, R. J., Randich, S., & Barrado y Navascués, D. 2005, A&A, 429, 1051 [NASA ADS] [CrossRef] [EDP Sciences] [Google Scholar]
- McQuillan, A., Aigrain, S., & Mazeh, T. 2013a, MNRAS, 432, 1203 [NASA ADS] [CrossRef] [MathSciNet] [Google Scholar]
- McQuillan, A., Mazeh, T., & Aigrain, S. 2013b, ApJ, 775, L11 [NASA ADS] [CrossRef] [Google Scholar]
- Melis, C., Reid, M. J., Mioduszewski, A. J., Stauffer, J. R., & Bower, G. C. 2014, Science, 345, 1029 [NASA ADS] [CrossRef] [PubMed] [Google Scholar]
- Mermilliod, J.-C., Rosvick, J. M., Duquennoy, A., & Mayor, M. 1992, A&A, 265, 513 [NASA ADS] [Google Scholar]
- Michaud, G., & Charbonneau, P. 1991, Space Sci. Rev., 57, 1 [NASA ADS] [CrossRef] [Google Scholar]
- Oppenheimer, B. R., Basri, G., Nakajima, T., & Kulkarni, S. R. 1997, AJ, 113, 296 [NASA ADS] [CrossRef] [Google Scholar]
- Palla, F., Randich, S., Pavlenko, Y. V., Flaccomio, E., & Pallavicini, R. 2007, ApJ, 659, L41 [NASA ADS] [CrossRef] [Google Scholar]
- Pasquini, L., Randich, S., & Pallavicini, R. 1997, A&A, 325, 535 [NASA ADS] [Google Scholar]
- Pasquini, L., Biazzo, K., Bonifacio, P., Randich, S., & Bedin, L. R. 2008, A&A, 489, 677 [NASA ADS] [CrossRef] [EDP Sciences] [Google Scholar]
- Pavlenko, Y. V., & Magazzu, A. 1996, A&A, 311, 961 [NASA ADS] [Google Scholar]
- Perryman, M. A. C., Lindegren, L., Kovalevsky, J., et al. 1997, A&A, 323, L49 [NASA ADS] [Google Scholar]
- Pilachowski, C. 1986, ApJ, 300, 289 [NASA ADS] [CrossRef] [Google Scholar]
- Pilachowski, C. A., Mould, J. R., & Siegel, M. J. 1984, ApJ, 282, L17 [NASA ADS] [CrossRef] [Google Scholar]
- Pilachowski, C. A., Booth, J., & Hobbs, L. M. 1987, PASP, 99, 1288 [NASA ADS] [CrossRef] [Google Scholar]
- Pilachowski, C., Saha, A., & Hobbs, L. M. 1988, PASP, 100, 474 [NASA ADS] [CrossRef] [Google Scholar]
- Pinfield, D. J., Hodgkin, S. T., Jameson, R. F., et al. 2000, MNRAS, 313, 347 [NASA ADS] [CrossRef] [Google Scholar]
- Pinfield, D. J., Dobbie, P. D., Jameson, R. F., et al. 2003, MNRAS, 342, 1241 [NASA ADS] [CrossRef] [Google Scholar]
- Pinsonneault, M. H., Stauffer, J., Soderblom, D. R., King, J. R., & Hanson, R. B. 1998, ApJ, 504, 170 [NASA ADS] [CrossRef] [Google Scholar]
- Queloz, D., Allain, S., Mermilliod, J.-C., Bouvier, J., & Mayor, M. 1998, A&A, 335, 183 [NASA ADS] [Google Scholar]
- Randich, S. 2001, A&A, 377, 512 [NASA ADS] [CrossRef] [EDP Sciences] [Google Scholar]
- Randich, S., Pallavicini, R., Meola, G., Stauffer, J. R., & Balachandran, S. C. 2001, A&A, 372, 862 [NASA ADS] [CrossRef] [EDP Sciences] [Google Scholar]
- Randich, S., Gilmore, G., & Gaia-ESO Consortium 2013, The Messenger, 154, 47 [NASA ADS] [Google Scholar]
- Rebolo, R., Martin, E. L., Basri, G., Marcy, G. W., & Zapatero-Osorio, M. R. 1996, ApJ, 469, L53 [NASA ADS] [CrossRef] [Google Scholar]
- Rosvick, J. M., Mermilliod, J.-C., & Mayor, M. 1992, A&A, 255, 130 [NASA ADS] [Google Scholar]
- Sacco, G. G., Jeffries, R. D., Randich, S., et al. 2015, A&A, 574, L7 [NASA ADS] [CrossRef] [EDP Sciences] [Google Scholar]
- Sarro, L. M., Bouy, H., Berihuete, A., et al. 2014, A&A, 563, A45 [NASA ADS] [CrossRef] [EDP Sciences] [Google Scholar]
- Sergison, D. J., Mayne, N. J., Naylor, T., Jeffries, R. D., & Bell, C. P. M. 2013, MNRAS, 434, 966 [NASA ADS] [CrossRef] [Google Scholar]
- Siess, L., Dufour, E., & Forestini, M. 2000, A&A, 358, 593 [Google Scholar]
- Skrutskie, M. F., Cutri, R. M., Stiening, R., et al. 2006, AJ, 131, 1163 [NASA ADS] [CrossRef] [Google Scholar]
- Soderblom, D. R., Fedele, S. B., Jones, B. F., Stauffer, J. R., & Prosser, C. F. 1993a, AJ, 106, 1080 [NASA ADS] [CrossRef] [Google Scholar]
- Soderblom, D. R., Jones, B. F., Balachandran, S., et al. 1993b, AJ, 106, 1059 [NASA ADS] [CrossRef] [Google Scholar]
- Soderblom, D. R., Pilachowski, C. A., Fedele, S. B., & Jones, B. F. 1993c, AJ, 105, 2299 [NASA ADS] [CrossRef] [Google Scholar]
- Soderblom, D. R., Stauffer, J. R., Hudon, J. D., & Jones, B. F. 1993d, ApJS, 85, 315 [NASA ADS] [CrossRef] [Google Scholar]
- Soderblom, D. R., Nelan, E., Benedict, G. F., et al. 2005, AJ, 129, 1616 [NASA ADS] [CrossRef] [Google Scholar]
- Somers, G., & Pinsonneault, M. H. 2014, ApJ, 790, 72 [NASA ADS] [CrossRef] [Google Scholar]
- Somers, G., & Pinsonneault, M. H. 2015, MNRAS, 449, 4131 [NASA ADS] [CrossRef] [Google Scholar]
- Stauffer, J. R., & Hartmann, L. W. 1987, ApJ, 318, 337 [NASA ADS] [CrossRef] [Google Scholar]
- Stauffer, J. R., Schild, R., Barrado y Navascues, D., et al. 1998a, ApJ, 504, 805 [NASA ADS] [CrossRef] [Google Scholar]
- Stauffer, J. R., Schultz, G., & Kirkpatrick, J. D. 1998b, ApJ, 499, L199 [NASA ADS] [CrossRef] [Google Scholar]
- Stauffer, J. R., Jones, B. F., Backman, D., et al. 2003, AJ, 126, 833 [NASA ADS] [CrossRef] [Google Scholar]
- Stauffer, J. R., Hartmann, L. W., Fazio, G. G., et al. 2007, ApJS, 172, 663 [NASA ADS] [CrossRef] [Google Scholar]
- Stuik, R., Bruls, J. H. M. J., & Rutten, R. J. 1997, A&A, 322, 911 [NASA ADS] [Google Scholar]
- Thorburn, J. A., Hobbs, L. M., Deliyannis, C. P., & Pinsonneault, M. H. 1993, ApJ, 415, 150 [NASA ADS] [CrossRef] [Google Scholar]
- van Leeuwen, F. 1999, A&A, 341, L71 [NASA ADS] [Google Scholar]
- van Leeuwen, F. 2009, A&A, 500, 505 [NASA ADS] [CrossRef] [EDP Sciences] [Google Scholar]
All Figures
|
Fig. 1 Proper motions for Pleiades and Taurus-Auriga members. We distinguished four cases: green solid circles for lithium detection and membership probability larger than 0.75; blue open circles for lithium upper limits and membership probability larger than 0.75; magenta solid circles for lithium detection and membership probability less than 0.75; red open circles for lithium upper limits and membership probability less than 0.75. Membership probabilities come from Bouy et al. (2015). Light gray plus symbols are used for Taurus-Auriga members (taken from Ducourant et al. 2005). |
| In the text | |
|
Fig. 2 Hertzsprung-Russell diagrams showing Pleiades data. The isochrones correspond to Siess et al. (2000), 1, 3, 5, 7, 10, 15, 20, 30, 50, 125 Myr, and 5 Gyr; BT-Settl by the Lyon group (Allard et al. 2012), 1, 20, 120 Myr, and 10 Gyr. The 120/125 Myr isochrones are highlighted. Symbols as in Fig. 1. |
| In the text | |
|
Fig. 3 Lithium equivalent width (top) and lithium abundance (bottom) vs. effective temperature. The diagram shows all relevant data, including multiple measurements for the same stars and known binaries. The symbols are as follows: green solid circles indicate lithium detection and membership probability larger than 0.75; blue open triangles indicate lithium upper limits and membership probability larger than 0.75; magenta solid circles indicate lithium detection and membership probability less than 0.75; and red open triangles indicate lithium upper limits and membership probability less than 0.75. Membership probabilities come from Bouy et al. (2015). The curves correspond to BT-Settl models from Allard et al. (2012). The central dips denote 10 and 20 Myr, the blue side of the lithium abyss includes values for 50 and 125 Myr, and the red side shows the computation for 50, 90, 125, and 150 Myr. |
| In the text | |
|
Fig. 4 Zoom for the Hertzsprung-Russell diagram showing Pleiades FGK members. The isochrones correspond to Siess et al. (2000), with ages of 1, 3, 5, 7, 10, 15, 20, 30, 50, 125, Myr, and 5 Gyr. The 125 Myr isochrone is highlighted. Fast (green solid circles), moderate (open blue squares), and slow (open magenta triangles) rotators are defined by their location within the period vs. luminosity plot shown in Fig. 5. The same symbols and color codes are used in the following figures. Empty large black circles indicate binaries (broken lines for suspected binaries). |
| In the text | |
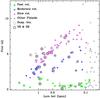 |
Fig. 5 Rotation period vs. the bolometric luminosity. Symbols as in Fig. 4. |
| In the text | |
|
Fig. 6 Lithium equivalent vs. bolometric luminosity for the high probable members (probability larger than 0.75). For those stars with multiple values of W(Li), only our selection is represented (see text). Top: binaries and suspected binaries are included and highlighted with large open circles. Middle and bottom: only single stars are shown. Lithium-rich stars are indicated with large, open diamonds. In the first case, selection B, we used the W(Li) selection based on the S/N, whereas in the second panel, selection A, we show the data based on spectral resolution. |
| In the text | |
|
Fig. 7 Photometric variability in the r band (top). The projected equatorial velocity (middle) and the fraction between the Lx and bolometric luminosities (bottom) vs. the rotational period. Only single stars are shown. The lithium-rich stars come from selection A, based on spectral resolution, although the result is practically identical if the stress is put on the S/N. HII 380 and HII 740 do not have a measured value of Lx, and HII 708 does not have a measured value of the photometric amplitude, and therefore they are not represented on some of these diagrams. |
| In the text | |
|
Fig. 8 Top: comparison of the X-ray and bolometric luminosities, taking the rotational periods into account. HII 380 and HII 740 do not have a measured value of Lx and therefore they are not represented on the diagram. Bottom: the amplitude of the light curve. Only single stars and the W(Li) based on the spectral resolution are shown in both panels. |
| In the text | |
Current usage metrics show cumulative count of Article Views (full-text article views including HTML views, PDF and ePub downloads, according to the available data) and Abstracts Views on Vision4Press platform.
Data correspond to usage on the plateform after 2015. The current usage metrics is available 48-96 hours after online publication and is updated daily on week days.
Initial download of the metrics may take a while.