Fig. 3
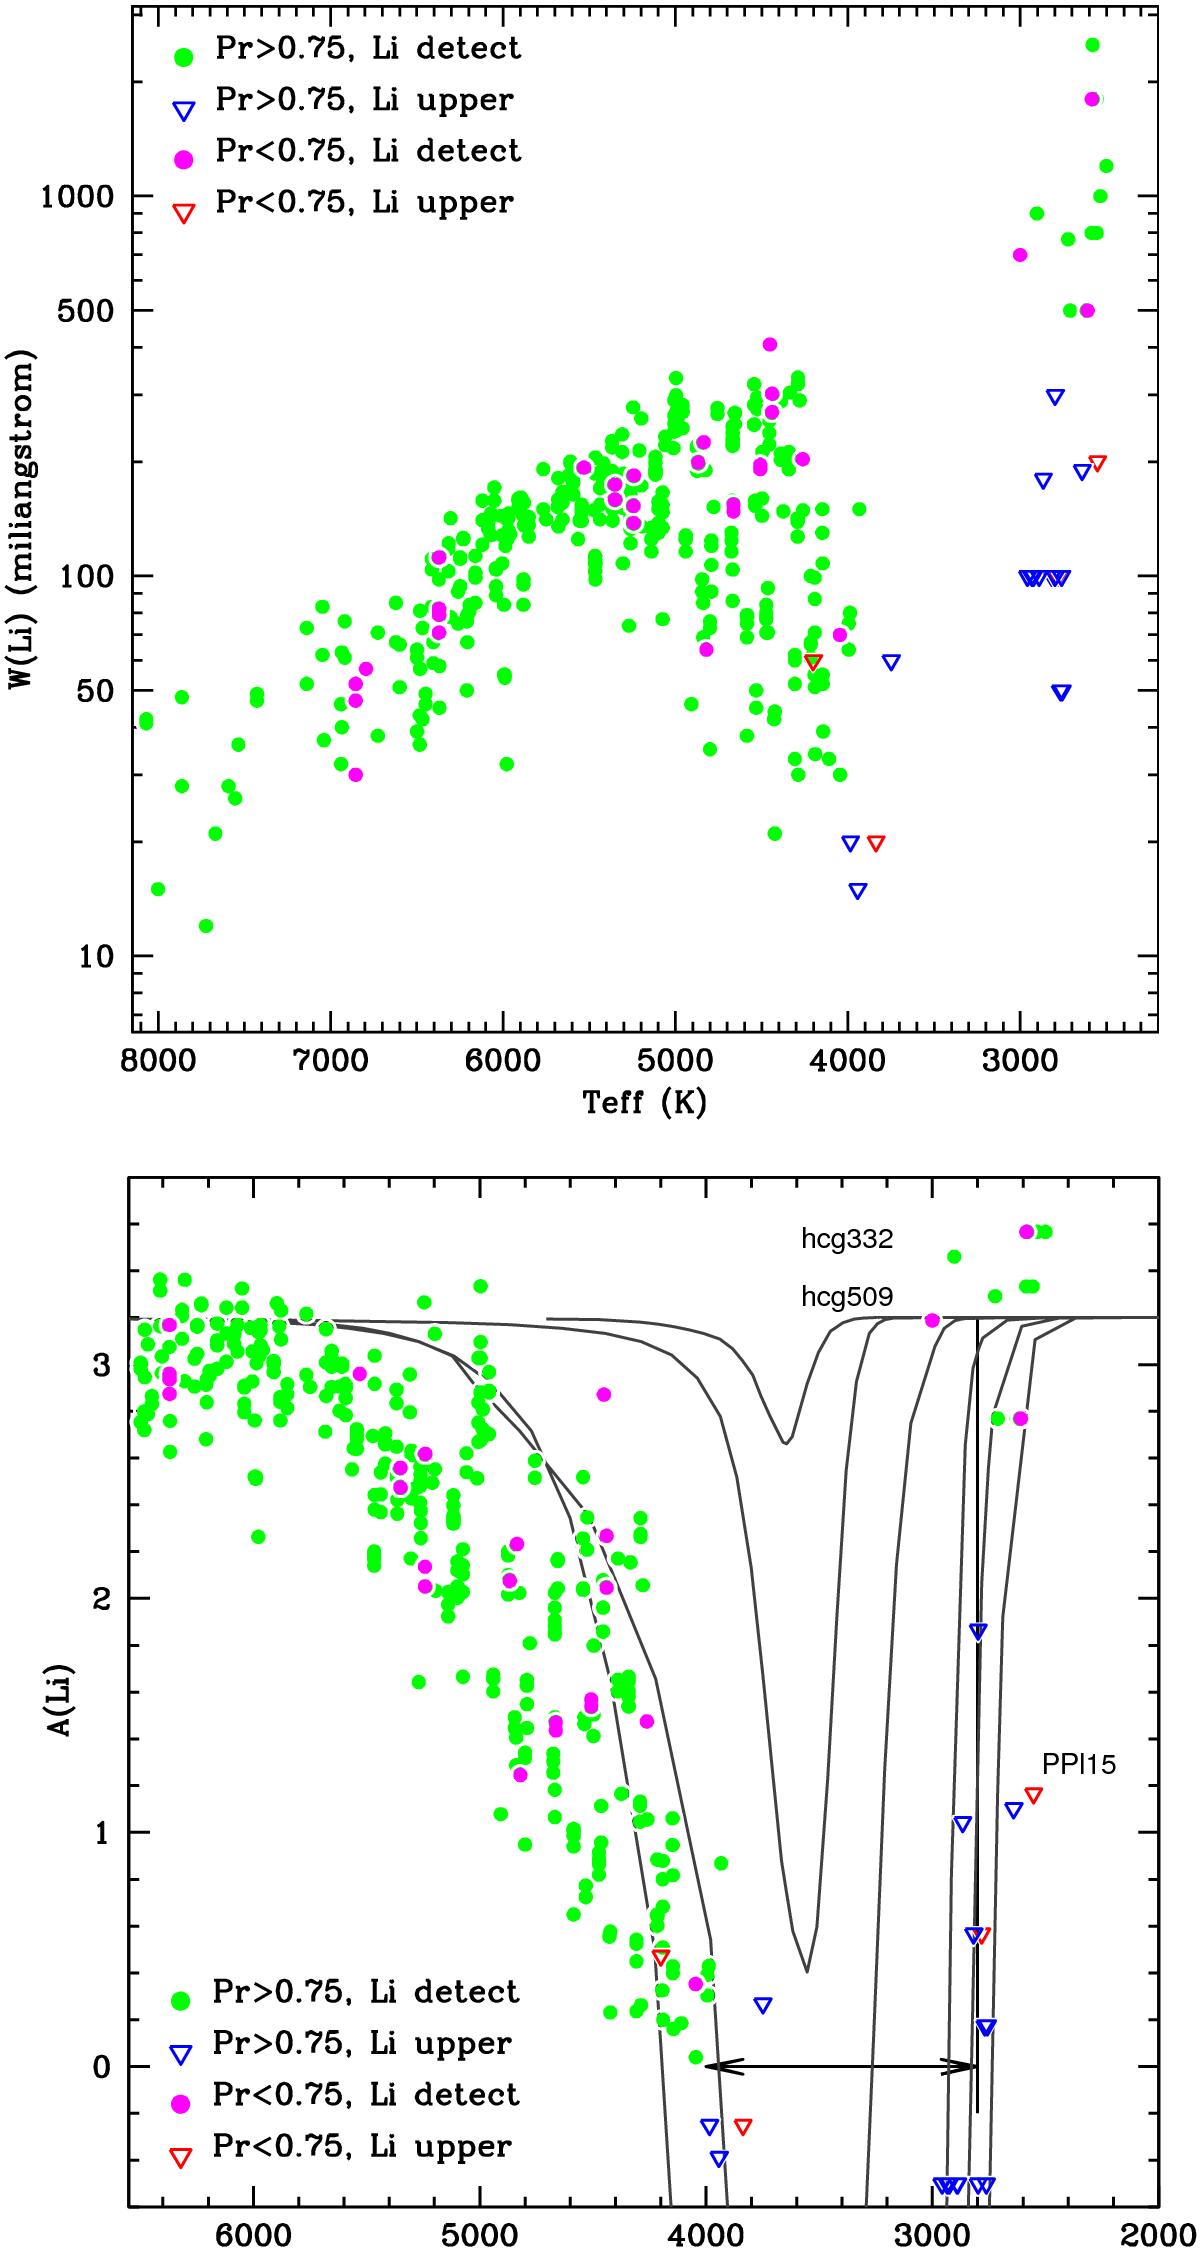
Lithium equivalent width (top) and lithium abundance (bottom) vs. effective temperature. The diagram shows all relevant data, including multiple measurements for the same stars and known binaries. The symbols are as follows: green solid circles indicate lithium detection and membership probability larger than 0.75; blue open triangles indicate lithium upper limits and membership probability larger than 0.75; magenta solid circles indicate lithium detection and membership probability less than 0.75; and red open triangles indicate lithium upper limits and membership probability less than 0.75. Membership probabilities come from Bouy et al. (2015). The curves correspond to BT-Settl models from Allard et al. (2012). The central dips denote 10 and 20 Myr, the blue side of the lithium abyss includes values for 50 and 125 Myr, and the red side shows the computation for 50, 90, 125, and 150 Myr.
Current usage metrics show cumulative count of Article Views (full-text article views including HTML views, PDF and ePub downloads, according to the available data) and Abstracts Views on Vision4Press platform.
Data correspond to usage on the plateform after 2015. The current usage metrics is available 48-96 hours after online publication and is updated daily on week days.
Initial download of the metrics may take a while.