Fig. 7
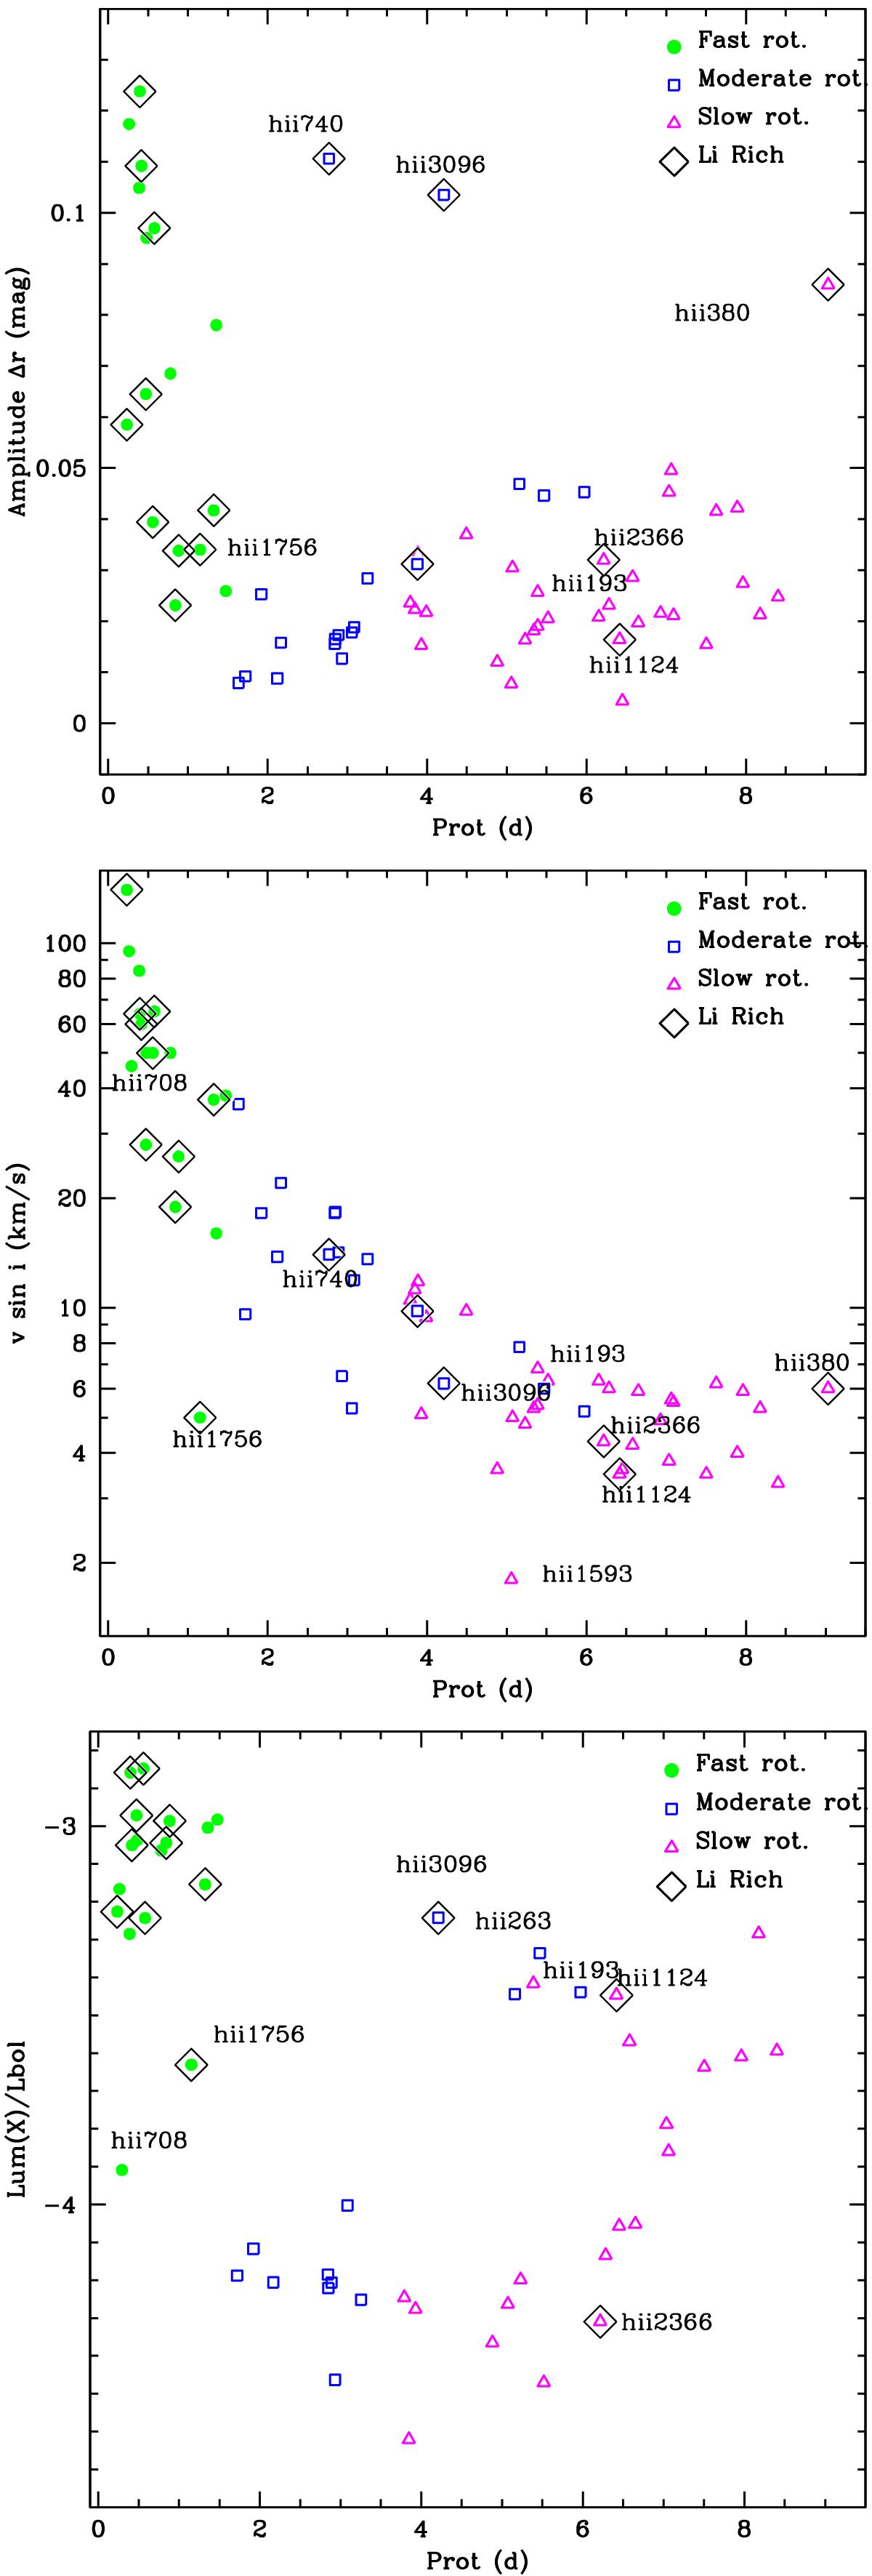
Photometric variability in the r band (top). The projected equatorial velocity (middle) and the fraction between the Lx and bolometric luminosities (bottom) vs. the rotational period. Only single stars are shown. The lithium-rich stars come from selection A, based on spectral resolution, although the result is practically identical if the stress is put on the S/N. HII 380 and HII 740 do not have a measured value of Lx, and HII 708 does not have a measured value of the photometric amplitude, and therefore they are not represented on some of these diagrams.
Current usage metrics show cumulative count of Article Views (full-text article views including HTML views, PDF and ePub downloads, according to the available data) and Abstracts Views on Vision4Press platform.
Data correspond to usage on the plateform after 2015. The current usage metrics is available 48-96 hours after online publication and is updated daily on week days.
Initial download of the metrics may take a while.