Fig. 5
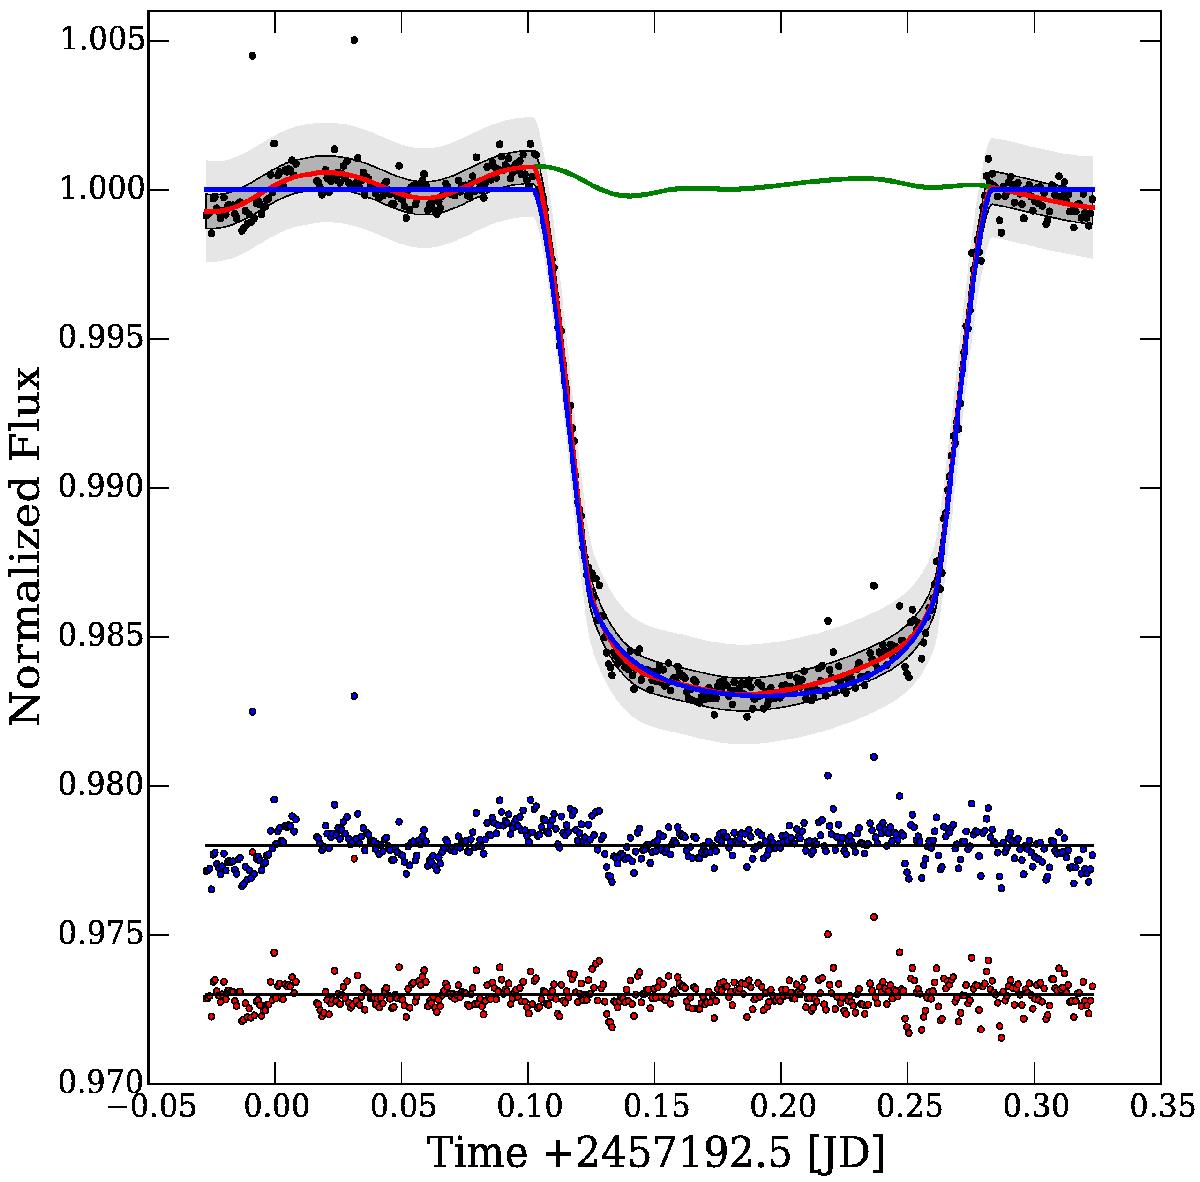
Broadband (white) light curve for the transit of WASP-17b, fitted with a GP model described in Sect. 3.3. The best fitting transit light curve is shown in blue with the GP mean model given as solid red line. The residuals of both models are shown at the bottom, where they are shifted for clarity and their colours correspond to the models that they represent. The dark and light grey regions represent the 1 and 3σ predictions of the GP model, respectively. The green line shows the systematics model without the transit function.
Current usage metrics show cumulative count of Article Views (full-text article views including HTML views, PDF and ePub downloads, according to the available data) and Abstracts Views on Vision4Press platform.
Data correspond to usage on the plateform after 2015. The current usage metrics is available 48-96 hours after online publication and is updated daily on week days.
Initial download of the metrics may take a while.