Fig. 2
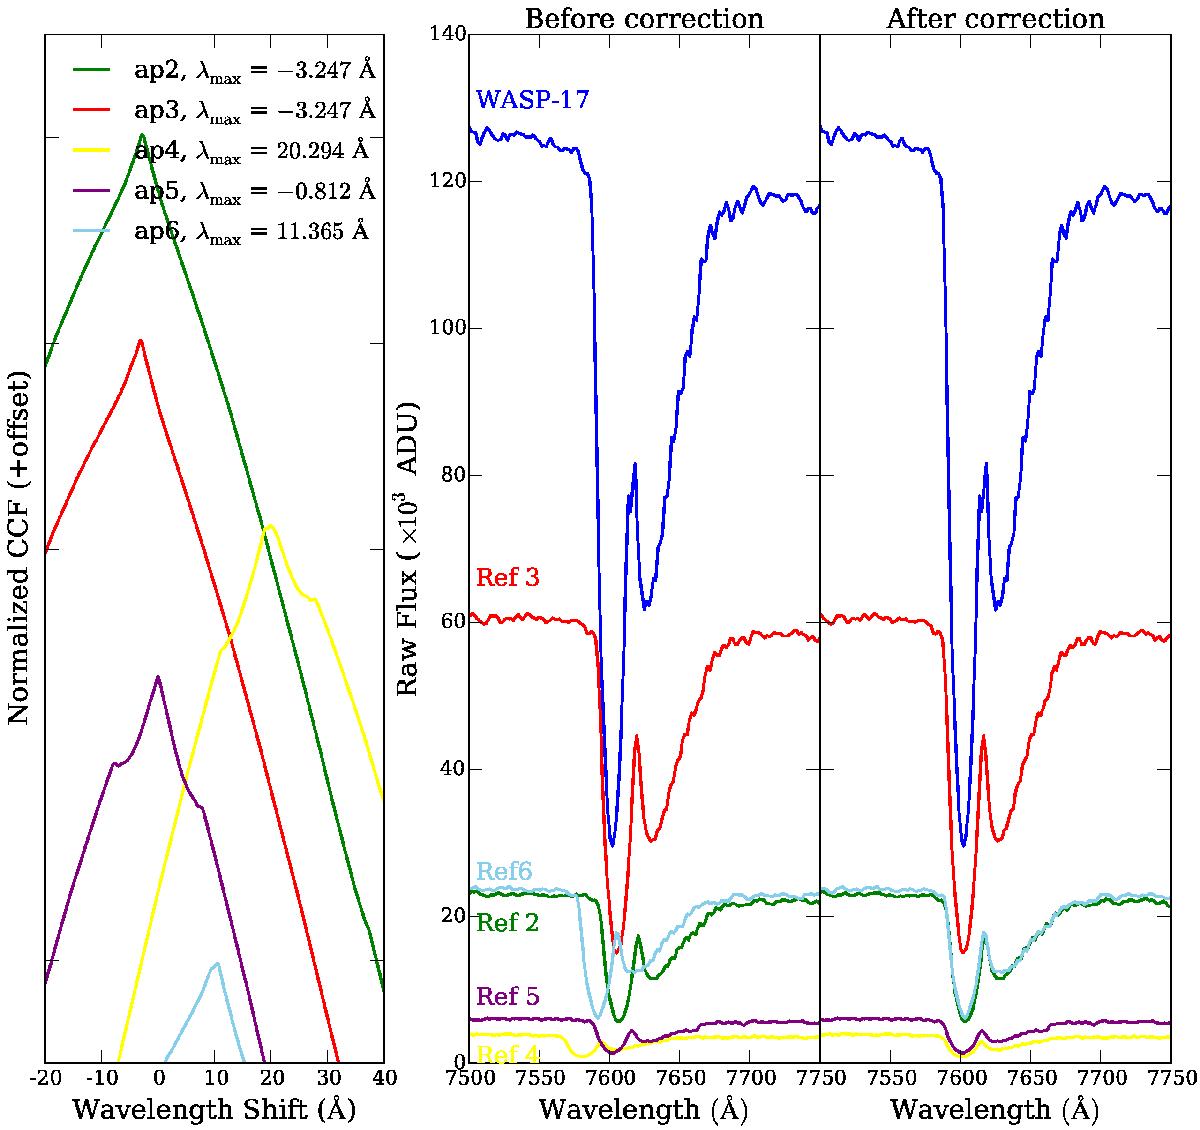
Left: cross-correlation functions, calculated for the wavelength solutions of all reference stars, with respect to the target. The maximising wavelength at each instance, presented in the figure, is then added to each wavelength solution for the correction of the spectra. Right: a zoom into the telluric O2 absorption region of the spectra, before and after the wavelength correction procedure.
Current usage metrics show cumulative count of Article Views (full-text article views including HTML views, PDF and ePub downloads, according to the available data) and Abstracts Views on Vision4Press platform.
Data correspond to usage on the plateform after 2015. The current usage metrics is available 48-96 hours after online publication and is updated daily on week days.
Initial download of the metrics may take a while.