Fig. 11
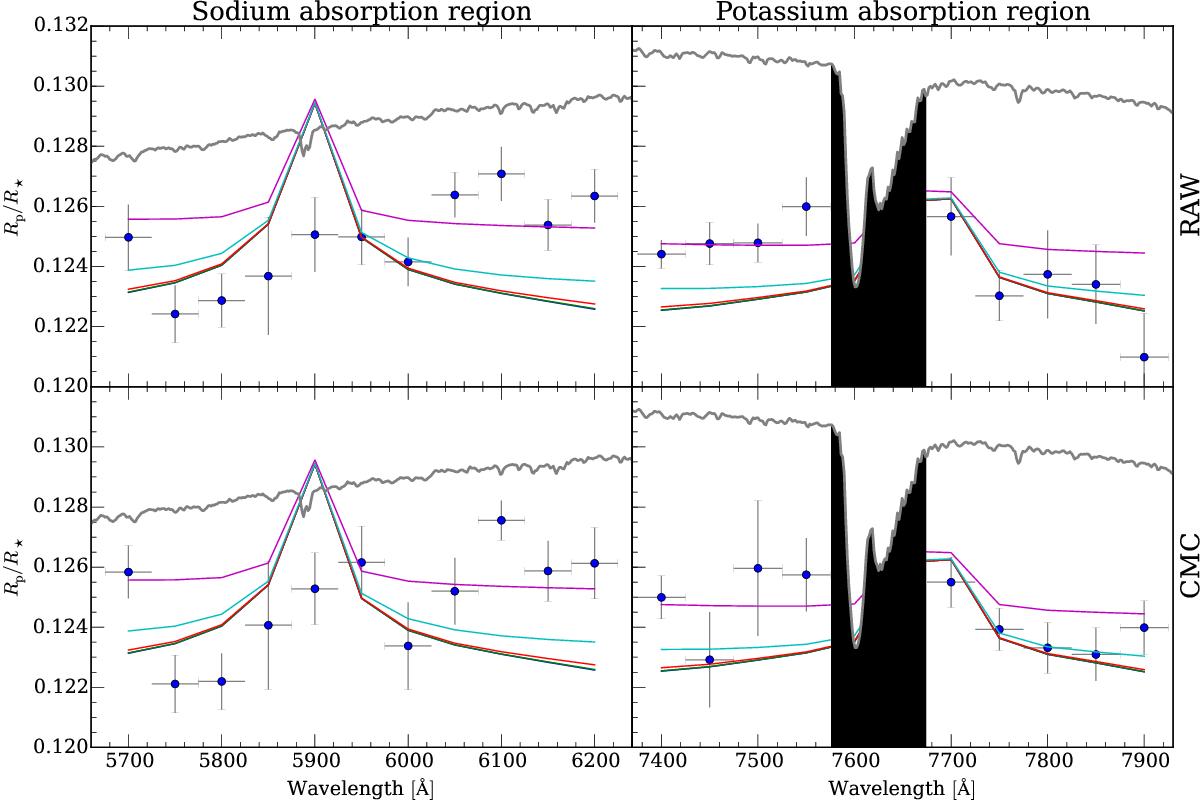
Transmission spectrum reproduced with 50 Å-wide bins, as compared to Fig. 10, for domains where the possible presence of optical absorbers, such as sodium (left column) and potassium (right column), would result in an increased planetary radius. The theoretical atmospheric models are also overplotted in addition to the inferred radii, and their colours correspond to those in Fig. 10, which have again been binned to the resolution of the spectrum and plotted for 1.6 scale heights, as was performed for the overall spectrum. It must be noted that these models have not been fitted to the data points and the transmission spectrum data have not been used as a priori for the production of the model atmospheres. The black shaded region in the right column highlights the region where telluric absorption as a result of the O2 (A) lines introduces significant systematics in the light curves produced in this region.
Current usage metrics show cumulative count of Article Views (full-text article views including HTML views, PDF and ePub downloads, according to the available data) and Abstracts Views on Vision4Press platform.
Data correspond to usage on the plateform after 2015. The current usage metrics is available 48-96 hours after online publication and is updated daily on week days.
Initial download of the metrics may take a while.