Fig. 10
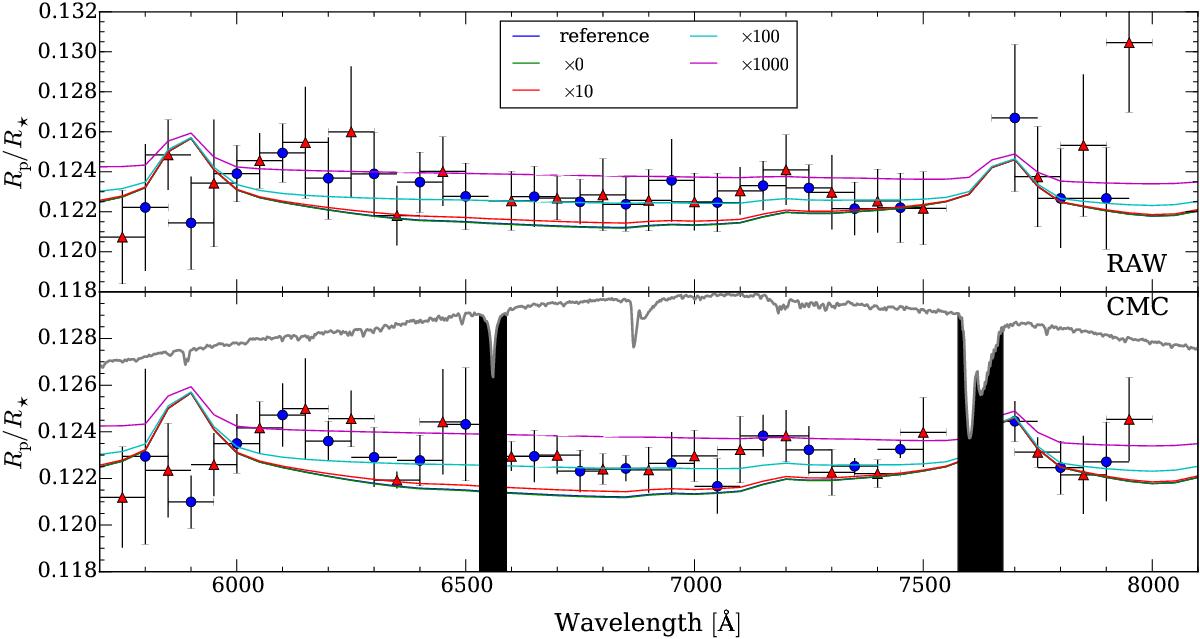
Transmission spectrum of WASP-17b produced from both without (top) and with (bottom) the CMC of the spectrophotometric light curves. Blue circles and red triangles are the results from light curves made with 100 Å bins, plotted as two separate sets to show transmission spectra with unique data points. Furthermore, synthetic transmission models for the reference aerosol profile scaled by factors of 0, 10, 100 and a 1000 are also overplotted. These models are binned within 100 Å channels to match the data. In the CMC plot, an example of a WASP-17 spectrum is overplotted in grey. Two regions of telluric absorption have been shaded black, where we avoid reporting results due to the low S/N. We emphasise that the models are not fitted to the data and simply just overplotted. Hence, we do not try the retrieval approach since the wavelength coverage of the spectrum is too limited for this approach.
Current usage metrics show cumulative count of Article Views (full-text article views including HTML views, PDF and ePub downloads, according to the available data) and Abstracts Views on Vision4Press platform.
Data correspond to usage on the plateform after 2015. The current usage metrics is available 48-96 hours after online publication and is updated daily on week days.
Initial download of the metrics may take a while.