Free Access
Fig. 1
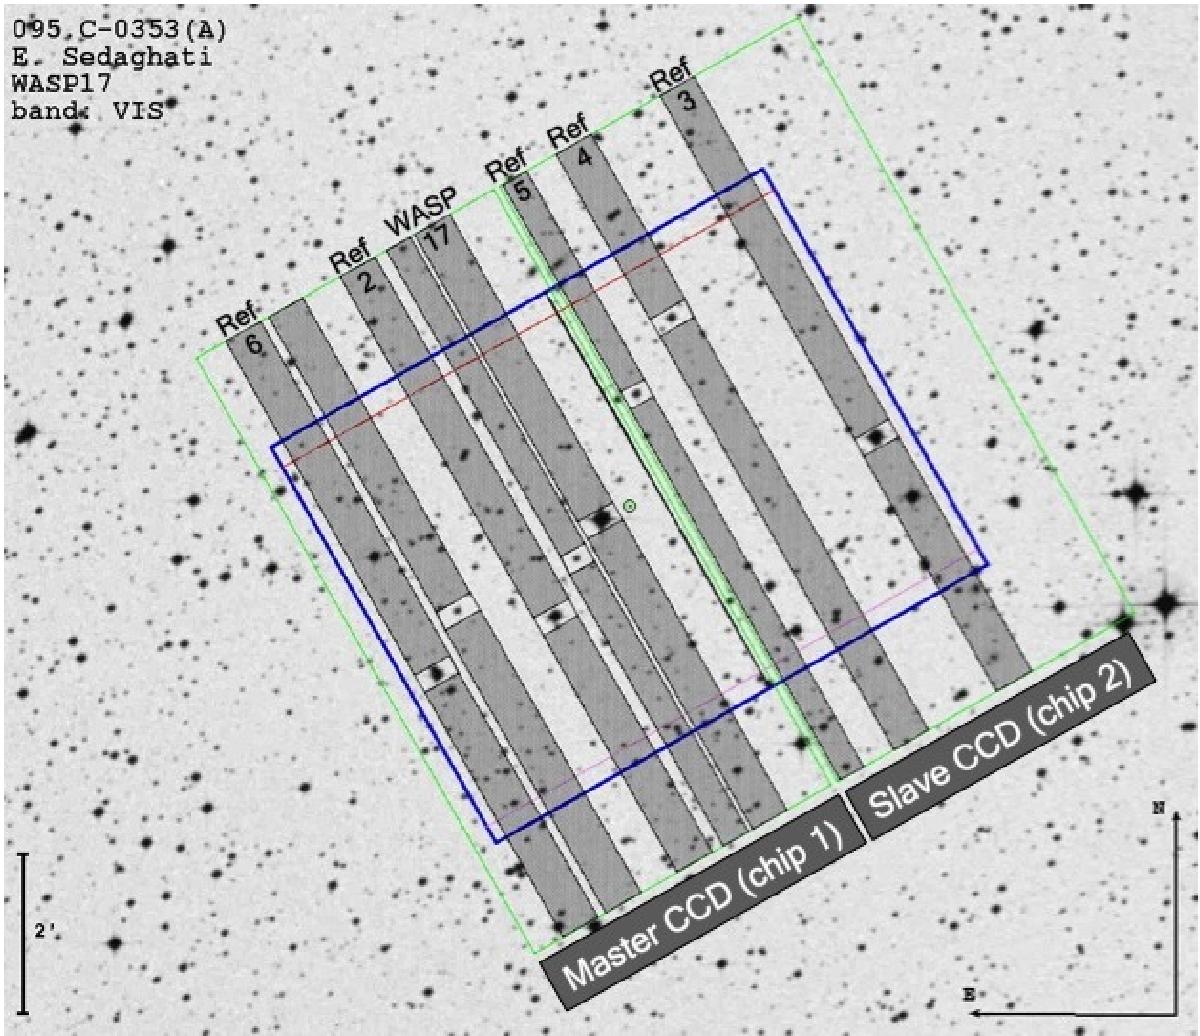
10′× 10′ plot encompassing the FoV of FORS2 (green box) and the area covered by the 2 (2k × 4k) MIT chip mosaic (in blue). The exact design and location of the MXU slits, with the relevant target designations are also shown. The grey regions are the sections of the CCD used for recording the individual stellar spectra.
Current usage metrics show cumulative count of Article Views (full-text article views including HTML views, PDF and ePub downloads, according to the available data) and Abstracts Views on Vision4Press platform.
Data correspond to usage on the plateform after 2015. The current usage metrics is available 48-96 hours after online publication and is updated daily on week days.
Initial download of the metrics may take a while.