| Issue |
A&A
Volume 596, December 2016
|
|
|---|---|---|
| Article Number | A54 | |
| Number of page(s) | 14 | |
| Section | Planets and planetary systems | |
| DOI | https://doi.org/10.1051/0004-6361/201628355 | |
| Published online | 29 November 2016 | |
Terrestrial planets and water delivery around low-mass stars
1 Instituto de Astrofísica de La Plata, CCT La Plata-CONICET-UNLP Paseo del Bosque S/N, 1900 La Plata, Argentina
e-mail: adugaro@fcaglp.unlp.edu.ar
2 Facultad de Ciencias Astronómicas y Geofísicas, Universidad Nacional de La Plata Paseo del Bosque S/N, 1900 La Plata, Argentina
3 Universidad Nacional de La Patagonia Austral, Unidad Académica Caleta Olivia Ruta 3 Acceso Norte, 9311 Caleta Olivia, Santa Cruz, CONICET, Argentina
Received: 20 February 2016
Accepted: 8 September 2016
Context. Theoretical and observational studies suggest that protoplanetary disks with a wide range of masses could be found around low-mass stars.
Aims. We analyze planetary formation processes in systems without gas giants around M3- and M0-type stars of 0.29 M⊙ and 0.5 M⊙, respectively. In particular, we assume disks with masses of 5% and 10% of the mass of the star. Our study focuses on the formation of terrestrial-like planets and water delivery in the habitable zone (HZ).
Methods. First, we use a semi-analytical model to describe the evolution of embryos and planetesimals during the gaseous phase. Then, a N-body code is used to analyze the last giant impact phase after the gas dissipation.
Results. For M3-type stars, five planets with different properties are formed in the HZ. These planets have masses of 0.072 M⊕, ~0.13 M⊕ (two of them), and 1.03 M⊕, and have water contents of 5.9%, 16.7%, 28.6%, and 60.6% by mass, respectively. Then, the fifth planet formed in the HZ is a dry world with 0.138 M⊕. For M0-type stars, four planets are produced in the HZ with masses of 0.28 M⊕, 0.51 M⊕, 0.72 M⊕, and 1.42 M⊕, and they have water contents of 26.7%, 45.8%, 68%, and 50.5% by mass, respectively.
Conclusions. M3- and M0-type stars represent targets of interest for the search of exoplanets in the HZ. In fact, the Mars-mass planets formed around M3-type stars could maintain habitable conditions in their early histories. Thus, the search for candidates around young M3-type stars could lead to the detection of planets analogous to early Mars. Moreover, Earth-mass planets should also be discovered around M3-type stars and, sub- and super-Earths should be detected around M0-type stars. Such planets are very interesting since they could maintain habitable conditions for very long.
Key words: astrobiology / methods: numerical / protoplanetary disks
© ESO, 2016
1. Introduction
Low-mass stars (namely, 0.08 M⊙ ≲ M⋆ ≲ 0.5 M⊙) are targets of study of significant interest because they are the most abundant in the galaxy. In fact, the very lowest mass stars dominate the galactic population (accounting for at least 70% of all stars) and make up roughly half of all stellar mass (Henry 2004).
Several studies have been developed to analyze the efficiency of planetary formation around low-mass stars (Raymond et al. 2007; Ogihara & Ida 2009; Montgomery & Laughlin 2009). In particular, Raymond et al. (2007) performed N-body simulations to study the process of terrestrial-like planet formation to a wide range of stellar masses (0.2 M⊙≲ M⋆ ≲ 1 M⊙). To do this, the authors assumed that the protoplanetary disk mass scales with stellar mass as  , where f measures the relative disk mass and 1/2 < h < 2, so that the disk mass decreases with decreasing stellar mass. Under this assumption, Raymond et al. (2007) showed that the terrestrial-like planets that formed in the habitable zone (HZ) around stars with masses M⋆ ≲ 0.6 M⊙ are small (≲0.3 M⊕) and dry, that is, with very low water content. According to the hypothesis of these authors, such stars have low-mass protoplanetary disks and therefore, the radial mixing of material and the water delivery on the planets formed in the HZ are inefficient processes. The results obtained by Raymond et al. (2007) suggests that stars with masses M⋆ ≲ 0.6 M⊙ are not likely to form potentially habitable planets.
In recent years, Andrews et al. (2010) analyzed the emission from 16 protoplanetary disks around stars with masses between 0.3 M⊙ and 2 M⊙ located in the Ophiuchus star-forming region. These authors analyzed the structure of such disks, suggesting that their masses are comparable and even larger than the 0.01 M⊙ associated with the minimum mass solar nebula (MMSN) derived by Hayashi (1981). In particular, Andrews et al. (2010) inferred the existence of a massive disk of 0.143 M⊙ around GSS 39, which is a M0-type star of 0.6 M⊙. This result suggest that low-mass stars can have associated massive protoplanetary disks.
Here, we present results of numerical simulations aimed at analyzing the formation of terrestrial-like planets around low-mass stars, assuming massive protoplanetary disks in the absence of gaseous giants. In particular, we propose to study M3- and M0-type stars, which have masses of 0.29 M⊙ and 0.5 M⊙, respectively (Tarter et al. 2007). Our study focuses on the formation of terrestrial-like planets and water delivery in the HZ of the system. We believe that the present work will allow us to clarify our understanding about the potential habitability in planetary systems around low-mass stars.
This paper is therefore structured as follows. In Sect. 2, we present the main properties of the protoplanetary disks used in our simulations for each star under study. In Sect. 3, we describe the semi-analytical model that allows us to analyze the evolution of a planetary system during the gaseous phase. Then, the N-body code used to carry out our dynamical simulations is presented in Sect. 4. In Sect. 5, we show our results and carry out a detailed analysis of all simulations. Finally, we discuss such results within the framework of the current knowledge of planetary systems and present our conclusions in Sect. 6.
2. Protoplanetary disk: properties
An important parameter that determines the distribution of material in a protoplanetary disk is the surface density. The surface density profile adopted in our model of protoplanetary disks is based on the evolution of a thin Keplerian disk that is subject to the gravity of a point-mass central star (Lynden-Bell & Pringle 1974; Hartmann et al. 1998). The gas-surface density profile Σg(R) is given by ![\begin{equation} \Sigma_{\text{g}}(R) = \Sigma_{\text{g}}^{0}\left(\frac{R}{R_{\text{c}}}\right)^{-\gamma} \text{exp}\left[-\left(\frac{R}{R_{\text{c}}}\right)^{2-\gamma}\right], \label{eq:gas} \end{equation}](/articles/aa/full_html/2016/12/aa28355-16/aa28355-16-eq13.png) (1)where R is the radial coordinate in the disk midplane,
(1)where R is the radial coordinate in the disk midplane,  a normalization constant, Rc a characteristic radius, and the exponent γ represents the surface density gradient. Integrating Eq. (1) over the total disk area, is written as a function of γ, Rc, and the mass of the disk Md. In the same way, we define a solid-surface density profile Σs given by
 ![\begin{equation} \Sigma_{\text{s}}(R) = \Sigma_{\text{s}}^{0}\eta_{\text{ice}}\left(\frac{R}{R_{\text{c}}}\right)^{-\gamma} \text{exp}\left[-\left(\frac{R}{R_{\text{c}}}\right)^{2-\gamma}\right], \label{e3} \end{equation}](/articles/aa/full_html/2016/12/aa28355-16/aa28355-16-eq20.png) (2)where
(2)where  is a normalization constant, and ηice is a parameter that represents an increase in the amount of solid material due to the condensation of water beyond the snow line. On the one hand,
 ![\hbox{$\Sigma_{\text{s}}^{0} = z_{0}\Sigma_{\text{g}}^{0}10^{[\text{Fe}/\text{H}]}$}](/articles/aa/full_html/2016/12/aa28355-16/aa28355-16-eq23.png) , where z0 = 0.0149 is the primordial abundance of heavy elements in the Sun (Lodders 2003), and [Fe/H] is the stellar metallicity. On the other hand, ηice adopts values of 0.25 and 1 inside and outside the snow line, respectively (Hayashi 1981). The results found in Lodders (2003) imply a jump in the surface density of solids at the snow line that is substantial, but smaller than the factor of 4 implied by the model of Hayashi (1981). Thus, strictly speaking, the results derived in our work should be associated with stars with metallicities slightly lower than solar.
, where z0 = 0.0149 is the primordial abundance of heavy elements in the Sun (Lodders 2003), and [Fe/H] is the stellar metallicity. On the other hand, ηice adopts values of 0.25 and 1 inside and outside the snow line, respectively (Hayashi 1981). The results found in Lodders (2003) imply a jump in the surface density of solids at the snow line that is substantial, but smaller than the factor of 4 implied by the model of Hayashi (1981). Thus, strictly speaking, the results derived in our work should be associated with stars with metallicities slightly lower than solar.
To define the position of the snow line in a disk around a given star, it is necessary to determine the temperature profile. In the optically thin regions of the disk, the dust and gas are heated to an equilibrium temperature T (Hayashi 1981) such that  (3)(Ida & Lin 2004) where L represents the luminosity of the star in solar unit. The position of the snow line Rice corresponds to the radius where T = 170 K, so that
  (4)Finally, the mass-luminosity relation for main-sequence stars with masses less than or equal to the mass of the Sun is obtained from the following expression
  (5)(Scalo et al. 2007) where M is the mass of the star in solar unit. This mass-luminosity relation is also used by Raymond et al. (2007) to develop N-body simulations around stars with different masses.
In the present work, our targets of study are M3- and M0-type stars, which have masses of 0.29 M⊙ and 0.5 M⊙, respectively (Tarter et al. 2007). Following Eqs. (4) and (5), the location of the snow line for M3- and M0-type stars is at 0.26 AU and 0.51 AU, respectively.
Taking the position of the snow line for a given star into account, we assume that the associated protoplanetary disk presents a radial compositional gradient. In particular, we consider that the water content by mass is a function of the radial coordinate in the disk midplane R. In fact, for M3-type stars, we assume that bodies located beyond 0.26 AU have 75% water by mass, while objects inside this boundary are dry. In the same way, for M0-type stars, we consider that bodies beyond 0.51 AU contain 75% water by mass, while objects inside the snow line do not contain water. Assuming a content of 75% water by mass for bodies located beyond the snow line is consistent with a value for ηice (Eq. (2)) of 4. For each studied star, such a distribution is assigned to each body in the simulations based on its starting location.
The main goal of our study is to analyze the formation and evolution of terrestrial-like planets in the HZ of a system. The HZ is defined as the range of heliocentric distances at which a planet could retain liquid water on its surface. The HZ depends on the luminosity of the star, which is a function of the stellar mass according to Eq. (5). Thus, we find that the smaller the mass of the star, the inner the HZ. Kopparapu et al. (2013b,a) established inner and outer limits for the HZ around stars of different spectral types. In particular, they defined conservative inner and outer edges for the HZ, which are determined by loss of water and by the maximum greenhouse provided by a CO2 atmosphere, respectively. The authors defined a conservative estimate for the width of the HZ around M3-type stars of 0.1–0.19 AU, while they computed a conservative estimate for the width of the HZ around M0-type stars of 0.2–0.37 AU. At the same time, the authors also determined optimistic inner and outer limits for the HZ. For the inner limit, an optimistic estimate is based on the inference that Venus has not had liquid water on its surface for at least the past 1 billion years (Solomon & Head 1991). For the outer limit, an optimistic empirical limit is estimated based on the observation that early Mars was warm enough for liquid water to flow on its surface (Pollack et al. 1987; Bibring et al. 2006). Kopparapu et al. (2013b,a) defined an optimistic estimate for the width of the HZ around M3-type stars of 0.077–0.2 AU, while they determined an optimistic estimate for the width of the HZ around M0-type stars of 0.15–0.39 AU. From these estimates, in the present work, we consider that a planet is in the HZ of the system and therefore can maintain liquid water on its surface if its whole orbit is contained inside the optimistic edges. In fact, for M3-type stars, a planet is assumed to be in the HZ of the system if its perihelion distance q ≥ 0.077 AU and its aphelion distance Q ≤ 0.2 AU. Similarly, a planet around a M0-type star is considered to be in the HZ if its perihelion distance q ≥ 0.15 AU and its aphelion distance Q ≤ 0.39 AU.
The requirement that the perihelion and aphelion distances are both inside the HZ for a planet to be habitable seems to be very conservative. In fact, Williams & Pollard (2002) showed that, provided that an ocean is present to act as a heat capacitor, it is primarily the time-averaged flux that affects the habitability over an eccentric orbit. Planets with high orbital eccentricities (e ≳ 0.1) have higher average orbital flux, which may help eccentric planets near the outer edge of the HZ to maintain habitable conditions.
Parameters such as the metallicity [Fe/H], the exponent γ, the characteristic radius Rc, the mass of the disk Md, and the gaseous component dissipation timescale τ must be determined to specify the various scenarios in this work. On the one hand, all simulations assume a central star of solar metallicity, namely, [Fe/H] = 0. On the other hand, for γ and Rc, we adopt values of 0.9 and 39 AU, respectively, which are in agreement with the median values of observations of different disks studied by Andrews et al. (2010) in the 1 Myr Ophiuchus star-forming region.
To determine the mass of the disks Md used in the present work as well as the gas dissipation timescale τ, the evolution of the planetary systems during the gas phase must be studied in detail. We are interested in analyzing planetary systems around M0- and M3-type stars in massive disks that lead to the formation of terrestrial-like planets or mini-Neptunes, but not gas giants. To specify values of Md and τ in agreement with such scenarios for M0- and M3-type stars, we use a semi-analytical model that is able to describe the evolution of a planetary system during the gaseous phase. A brief description of this semi-analytical model used in the present work can be found in the next section.
3. Semi-analytical model: gaseous phase
The semi-analytical model used for analyzing the evolution of the protoplanetary disk during the gaseous phase is based on the works developed by Brunini & Benvenuto (2008) and Guilera et al. (2010) with the inclusion of some minor improvements. A detailed description of the semi-analytical model used here can be found in de Elía et al. (2013).
The protoplanetary disk is characterized by a gaseous and a solid component. On the one hand, the gas surface density decreases exponentially by  (6)where Σg(R) is given by Eq. (1) and τ is a characteristic timescale. Mamajek (2009) carried out studies of young stellar clusters and indicated that the fraction of stars with optically thick primordial disks and/or those that show spectroscopic evidence for accretion appears to approximately follow an exponential decay with a characteristic time of τ = 2.5 Myr.
On the other hand, the solid component is represented by a planetesimal disk and a population of planetary embryos. The planetesimal disk is represented by a 2D grid: one dimension is associated with the radial coordinate in the disk midplane (R), and the other dimension is reserved for the different planetesimal sizes (rp). The initial planetesimal population evolves in time owing to nebular drag and accretion by the embryos. The evolution of the eccentricities and inclinations of the planetesimal population is governed by the gravitational stirring produced by the embryos (Ohtsuki et al. 2002), and the damping due to nebular gas (Rafikov 2004; Chambers 2008). Moreover, the gas drag also causes an inward orbital migration of the planetesimals. The interaction between the planetesimals and the gas depends on the planetesimal relative velocities with respect to the gas, and on the ratio between the planetesimal radius and the gas molecular mean free path. In the present study, we consider three different regimes (Rafikov 2004; Chambers 2008):
-
the Epstein regime;
-
the Stokes regime;
-
the quadratic regime.
As for the planetary embryos, they are initially distributed with separations of 10 mutual Hill radii, assuming circular and coplanar orbits. The initial mass of each embryo corresponds to the transition between runaway and oligarchic growth following the criteria derived by Ida & Makino (1993). According to these authors, such a mass is given by  (7)where R is the distance from the central star, mp the planetesimal mass, Σs the solid surface density, and M⊙ the mass of the star. The planetary embryos evolve in the disk, growing by accretion of planetesimals in the oligarchic regime, by the accretion of the surrounding gas, and by mutual accretion between them. The embryo’s feeding zone is often defined as the ring around itself where planetesimals can be accreted. We define the width of the feeding zone as about four times (at both sides of the embryo) Hill radius of the embryo. To model the accretion of planetesimals, we use the prescriptions derived by Inaba et al. (2001). As for the accretion of the surrounding gas, the semi-analytical model solves the classical equation of transport and structure for the planet envelope (Fortier et al. 2009; Guilera et al. 2010). Finally, we consider that when the distance between two planetary embryos becomes smaller than 3.5 mutual Hill radii, they are perfectly merged into one object. In the present study, the semi-analytical model assumes that the mass of the new embryo is the sum of the masses of the cores of the merged embryos, while the individual gaseous envelopes are dissipated. This model does not consider gravitational perturbations between planetary embryos during the gaseous phase. The semi-analytical model does not include the effects of the type I migration for the planetary embryos. Assuming idealized isothermal disks, Tanaka et al. (2002) determined rapid inward type I migration rates. From this, several authors used an ad-hoc factor to reduce the type I migration rates to reproduce the observations (Alibert et al. 2005; Ida & Lin 2008; Miguel et al. 2011b,a). Moreover, if more realistic protoplanetary disks are assumed (Kley & Crida 2008; Paardekooper et al. 2010, 2011; Guilet et al. 2013) or a more refined treatment of the accretion process of solid material by an embryo is considered (Benítez-Llambay et al. 2015), the type I migration could substantially change and lead to a more complex problem. In order to not complicate our model, we do not include the effects of the type I migration and thus, we consider the in situ formation of the planetary embryos in all our simulations.
The semi-analytical model can be adapted to analyze the formation process of a gaseous giant in a given disk. The standard model of giant planet formation suggests that the planetary growth is produced in two main stages (Mizuno 1980; Pollack et al. 1996). The first stage corresponds to the formation of a massive core by planetesimal accretion. Then, when the core becomes massive enough (≳10 M⊕), the gas accretion process starts to be more effective. When the mass of the envelope approximately reaches the mass of the core, the gas accretion is triggered and starts the gaseous runaway accretion, by producing the formation of a giant planet. From this, the semi-analytical model can be used to determine if a given protoplanetary disk is able or not to form a gaseous giant in the system. To do this, the model calculates the in situ formation of an embryo with a gaseous envelope around the snow line, where two combined factors such as the width of the feeding zone and the planetesimal surface density are maximized.
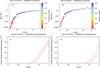 |
Fig. 1 Distribution of embryos and planetesimals for disks of 0.0145 M⊙ and 0.029 M⊙ around a M3-type star at the end of the gaseous phase. Top panels: mass distributions of planetary embryos as a function of the distance from the central star. The color palette indicates the fraction of initial water for the embryos. Bottom panels: surface density profiles of planetesimals for each disk under consideration. |
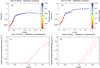 |
Fig. 2 Distribution of embryos and planetesimals for disks of 0.025 M⊙ and 0.05 M⊙ around a M0-type star at the end of the gaseous phase. Top panels: mass distributions of planetary embryos as a function of the distance from the central star. The color palette indicates the fraction of initial water for the embryos. Bottom panels: surface density profiles of planetesimals for each disk under consideration. |
We use the semi-analytical model to analyze the evolution of a planetary system during the gaseous phase around M3- and M0-type stars. For each stellar target, we assume massive protoplanetary disks with masses of 5% and 10% of the mass of the star. Thus, for M3-type stars, we adopt disks of 0.0145 M⊙ and 0.029 M⊙, while, for M0-type stars, disks of 0.025 M⊙ and 0.05 M⊙ are considered. We note that the disks we are studying are gravitationally stable according to the Toomre (1974) criterion. Moreover, for all scenarios in this work, we assume that the gaseous component of the protoplanetary disk is fully dissipated in a characteristic time of τ = 2.5 Myr. As for the planetesimal population, the semi-analytical model assumes only one species of planetesimals with a size of 10 km radius for all the simulations.
First of all, the semi-analytical model is used to determine if the protoplanetary disks proposed here around M3- and M0-type stars are able to form a gaseous giant planet in the system. Our simulations indicate that the studied systems do not form any giant planet. From this, the semi-analytical model is used to describe the evolution of planetary embryos and a planetesimal population during the gaseous phase.
Figure 1 gives the distribution of planetary embryos and planetesimals between 0.05 AU and 2 AU at the end of the gaseous phase for disks of 0.0145 M⊙ and 0.029 M⊙, around an M3-type star. In particular, the mass distributions of planetary embryos as a function of the distance from the central star for disks of 0.0145 M⊙ and 0.029 M⊙ are shown in Figs. 1a and c, respectively. Moreover, the surface density profiles of planetesimals for disks of 0.0145 M⊙ and 0.029 M⊙ are represented in Figs. 1b and d, respectively. According to Fig. 1, the planetary embryos accrete most planetesimals of their feeding zones during the gaseous phase inside 1 AU and 1.5 AU for disks of 0.0145 M⊙ and 0.029 M⊙, respectively. For each protoplanetary disk, we decided to select as a region of study the region in which the planetary embryos accrete most planetesimals of their feeding zones during the gaseous phase. Thus, for the 0.0145 M⊙ disk, our region of study extends from 0.05 AU to 1 AU, while for the 0.029 M⊙ disk, our region of study is confined between 0.05 AU and 1.5 AU.
In the same way, Fig. 2 shows the distribution of planetary embryos and planetesimals between 0.09 AU and 3 AU at the end of the gaseous phase, for disks of 0.025 M⊙ and 0.05 M⊙, around a M0-type star. In particular, Figs. 2a and c represent the mass distributions of planetary embryos as a function of the distance from the central star for disks of 0.025 M⊙ and 0.05 M⊙, respectively. Moreover, Figs. 2b and d show the surface density profiles of planetesimals for disks of 0.025 M⊙ and 0.05 M⊙, respectively. Using the same reasoning as used above for M3-type stars, our working region is confined between 0.09 AU and 1.5 AU for the 0.025 M⊙ disk, and between 0.09 AU and 2 AU for the 0.05 M⊙ disk.
For both stars, it is worth noting that, for each disk under consideration, the boundaries of each working region cover the HZ, the snow line, and a population of water-rich outer embryos. Moreover, as Raymond et al. (2007), our analysis does not include the effects of the outer remnant planetesimal population.
The distributions of planetary embryos confined in the working region for each star and each protoplanetary disk represent the initial conditions to be used in the N-body simulations.
4. N-body simulations: post-gas phase
The N-body code used to carry out our study was developed by Chambers (1999) and is known as MERCURY. In particular, we make use of the hybrid integrator, which uses a second-order mixed variable symplectic algorithm to treat the interaction between objects with separations greater than 3 Hill radii, and a Burlisch-Stoer method for resolving closer encounters.
The MERCURY code evolves the orbits of planetary embryos and planetesimals and allows collisions to occur. As we mentioned in Sect. 3, we do not include planetesimals in our N-body simulations. It is worth noting that collisions between embryos are treated as inelastic mergers, which conserve mass and water content. In fact, our model does not consider water loss during impacts, so that the final water contents of the resulting planets represent upper limits.
To use the MERCURY code, it is necessary to specify physical and orbital parameters for the planetary embryos involved in each simulation. For M3-type stars, we use protoplanetary disks of 0.0145 M⊙ and 0.029 M⊙. For the 0.0145 M⊙ disk, 403 planetary embryos are distributed between 0.05 AU and 1 AU, with masses ranging from 6.5 × 10⁻⁵M⊕ to 0.05 M⊕ (Fig. 1a). For the 0.029 M⊙ disk, the system contains 280 planetary embryos between 0.09 AU and 1.5 AU, which have masses between 1.3 × 10⁻⁴M⊕ and 0.19 M⊕ (Fig. 1b). As we mentioned in Sect. 3, we use protoplanetary disks of 0.025 M⊙ and 0.05 M⊙ for M0-type stars. For the 0.025 M⊙ disk, the system contains 194 planetary embryos between 0.09 AU and 1.5 AU, which have masses between 2.4 × 10⁻⁴M⊕ and 0.15 M⊕ (Fig. 2a). For the 0.05 M⊙ disk, 162 planetary embryos are confined between 0.09 AU and 2 AU, with masses ranging from 10-3M⊕ to 0.98 M⊕ (Fig. 2b). Finally, for any disk of work, we assume physical densities of 3 g cm-3 for all planetary embryos.
As for the orbital parameters of the planetary embryos, eccentricities and inclinations are taken randomly considering values lower than 0.02 and 0.5°, respectively. In the same way, we adopt random values for the argument of pericenter ω, longitude of ascending node Ω, and the mean anomaly M between 0° and 360°.
To develop the numerical integrations, we use a time step of 0.08 days and 0.2 days for M3- and M0-type stars, respectively, which are shorter than 1/20th of the orbital period of the innermost body in the corresponding simulation. Moreover, to avoid any numerical error for small-perihelion orbits, we use a non-realistic size for the radius of the central star of 0.0096 AU and 0.018 AU for M3- and M0-type stars, respectively. We integrate each simulation for at least 150 Myr, which is a good choice as an upper limit for the formation timescale of the terrestrial planets of the solar system (Touboul et al. 2007; Dauphas & Pourmand 2011; Jacobson et al. 2014).
Because the stochastic nature of the accretion process, we carry out 10 N-body simulations for each star and each disk of work, producing a total of 40 runs; the energy is conserved better than 1 part in 103 in all cases.
5. Results
Here, we present results of N-body simulations for the formation of terrestrial planets around M3- and M0-type stars, in systems without giant planets. The main goal of our work is to study the process of formation of terrestrial-like planets and the water delivery in the HZ of such systems.
The N-body simulations performed in the present study produce planetary systems that can be classified into the following four classes:
-
Class 1: systems with a planet whose orbit is fully containedwithin the boundaries of the HZ;
-
Class 2: systems with a planet whose perihelion is fully contained within the boundaries of the HZ; where its aphelion oscillates in and out of such a region;
-
Class 3: systems with a planet whose aphelion is fully contained within the boundaries of the HZ; where its perihelion oscillates in and out of such region;
-
Class 4: systems without planets in the HZ.
In particular, Class 1 represents those systems of astrobiological interest formed in our simulations. However, systems of Class 2 also must be considered, taking into account the criterion based on averaged flux proposed by Williams & Pollard (2002), as we mentioned in Sect. 2.
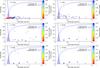 |
Fig. 3 Evolution in time of a simulation corresponding to a 0.0145 M⊙ disk around a M3-type star. Planetary embryos are plotted as circles following the color scale, which represents the fraction of water with respect to their total masses. The blue and light blue shaded areas represent the conservative and optimistic HZ, respectively. Moreover, the blue and light blue curves represent curves of constant perihelion and aphelion, both for the conservative and optimistic HZ. In this case, a planet survives in the HZ with a mass of 0.133 M⊕ and a water content of 16.7% by mass, which is equal to 79.3 EOs. |
All our simulations associated with Classes 1 and 2 form two different kinds of planets in the HZ. The first kind of planet is represented by planets whose accretion seed starts the simulation beyond the snow line. Following Raymond et al. (2009) we define the accretion seed of a planet as the larger body in each of its collisions. According to the distributions of water proposed in Sect. 2, these planets have significant primordial water contents and have very high water percentages by mass at the end of the simulations. The second kind of planets formed in the HZ is represented by those whose accretion seeds start the simulation inside the snow line so that, they do not have primordial water contents. In fact, these planets acquire their water contents during the evolution and have a wide range of water percentages by mass at the end of the simulations.
The simulations developed in the present study form a wide diversity of planetary systems, producing planets with different masses, water contents, and dynamical properties.
5.1. General results for M3-type stars
Here, we study the process of planetary formation and water delivery around M3-type stars, considering protoplanetary disks of 0.0145 M⊙ and 0.029 M⊙.
5.2. Simulations with 0.0145 M⊙ disks
Figure 3 shows six snapshots in time on the semimajor axis-eccentricity plane of the evolution of a given simulation that considers a 0.0145 M⊙ disk around a M3-type star. In general terms, the overall progression of all the simulations performed can be described as follows. From the beginning, the planetary embryos are quickly excited by their own mutual gravitational perturbations and significantly increase their eccentricities. In time, the eccentricities of embryos increase until their orbits cross and accretion collisions occur. Then, planetary embryos grow by accretion of other embryos and the total number of bodies decreases. For the particular simulation shown in Fig. 3, a planet is formed in the HZ, with a mass of 0.133 M⊕ and a final water content of 16.7% by mass, which is equal to 79.3 Earth oceans (EOs). An EO is the amount of water on Earth’s surface, which is equivalent to 2.8 × 10⁻⁴M⊕. On the other hand, Marty (2012) suggested that the current water content in the mantle of the Earth is ~2 × 10⁻³M⊕. From these studies, the current Earth might have a water content of about 0.1%–0.2% by mass.
In general terms, each simulation forms only one planet in the inner region to the snow line with a mass ranging between 0.12 M⊕ and 0.18 M⊕. Moreover, in each simulation, two to four planets are produced beyond the snow line with masses between 0.09 M⊕ and 0.48 M⊕.
In particular, our research focuses on the planets surviving in the HZ. For the 0.0145 M⊙ disk, we find three systems of astrobiological interest of Class 1, and another one associated with Class 2. Moreover, our simulations produce three systems corresponding to Class 3, and another system corresponding to Class 4. Finally, we identified corrupted output files in two of ten N-body simulations developed in this scenario.
The values of the eccentricity and inclination of the surviving planets in the HZ for the disk under consideration are illustrated as blue filled circles in Fig. 4. Such points represent mean values computed over the last 10 Myr of evolution. These planets have mean eccentricities ranging from 0.08 to 0.18 and mean inclinations between 4.3° and 17°.
Figure 5 shows the evolution of the semimajor axis a, and the perihelion q and aphelion Q distances of the planet associated with the HZ in systems corresponding to Class 1 a), Class 2 b). and Class 3 c). Here, we show the results of one representative simulation for each of the three classes. Figure 5a shows the evolution of the planet surviving in the HZ in a system of Class 1. This planet starts the simulation between the outer edge of the HZ and the snow line, which is located at 0.26 AU. From the beginning, the planet suffers a slow migration due to interactions with planetary embryos. At 23 Myr, the planet migrates suddenly into the HZ and evolves with its orbit fully contained within such a region up to the end of the simulation. During its evolution in the HZ, the semimajor axis of the planet does not show significant changes, while the perihelion and aphelion distances oscillate because of changes in the eccentricity of its orbit.
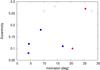 |
Fig. 4 Mean values of the eccentricity and inclination of the planets formed in the HZ over the last 10 Myr of evolution for each disk studied in this work. On the one hand, filled and open blue circles correspond to the disks of 0.0145 M⊙ and 0.029 M⊙, respectively. On the other hand, filled and open red circles are associated with the 0.025 M⊙ and 0.05 M⊙ disks, respectively. |
Figure 5b shows the evolution of the planet associated with the HZ in a system of Class 2. From the beginning of the simulation, this planet evolves within the limits of the HZ. At 2 × 10⁵ yr, the semimajor axis and eccentricity of the planet start to show changes due to perturbations exerted by planetary embryos. From 8 Myr up to the end of the simulation, the semimajor axis and the perihelion distance evolve into the HZ and the aphelion distance oscillates beyond the outer edge of the HZ. It is important to note that the eccentricity of this planet shows large oscillations, reaching a maximum value of 0.44. The time-averaged incident stellar flux on an eccentric planet is given by 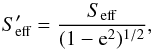 (8)where Seff is the effective flux from circular orbit. Following the evolution of the planet associated with the HZ, the time-averaged incident stellar flux is up to 11.3% higher than the effective flux from circular orbit. This may help the eccentric planet near the outer edge of the HZ maintain habitable conditions. Finally, Fig. 5c shows the evolution of the planet associated with the HZ in a system of Class 3. In this case, the planet starts to evolve with its orbit fully contained within the HZ. However, at 5 Myr, the planet is strongly perturbed, which produces significant changes in the values of its semimajor and eccentricity. In fact, the semimajor axis and the aphelion distance of the planet evolve into the HZ, but the perihelion distance oscillates reaching values less than the inner edge of the HZ. The surface of such a planet will be too hot to maintain habitability conditions.
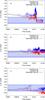 |
Fig. 5 Evolution in time of the semimajor axis (black), and the perihelion (red) and the aphelion (blue) distances for three planets associated with the HZ that correspond to systems of Class 1 (a), Class 2 (b), and Class 3 (c), for a 0.0145 M⊙ disk around a M3-type star. The blue and light blue shaded areas represent the conservative and optimistic HZ, respectively. |
As we mentioned, our simulations produce four planets of relevant interest in the HZ, three of which are associated with systems of Class 1 and the other one is of Class 2. Figure 6 shows the mass of each planet surviving in the HZ as a function of time. These planets have final masses between 0.072 M⊕ and 0.138 M⊕. Our results suggest that the planets formed in the HZ acquire 62%–92% of their masses from the inner region to the snow line, while the remaining mass comes from beyond the snow line. Moreover, our simulations suggest that the last giant impact experienced by these planets occurs between 8.3 Myr and 57.7 Myr after the gaseous component dissipation. From this, the formation of these planets represent an early process in comparison with the formation of the Earth. In fact, the generally accepted scenario about the formation of the Earth suggests that the last giant impact experienced by our planet formed the Moon and initiated the final phase of core formation by melting Earth’s mantle. Based on highly siderophile element abundance measurements, Jacobson et al. (2014) determined a Moon-formation age of 95 ± 32 Myr after the condensation of the first solids in the solar system.
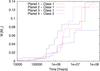 |
Fig. 6 Evolution of mass of the planets surviving in the HZ for a 0.0145 M⊙ disk around a M3-type star. |
Another topic of interest is to analyze the final water contents of the planets in the HZ. First of all, all planets that survive in the HZ start the simulation inside the snow line. Thus, they do not have primordial water contents. In fact, these planets acquire their final water percentages during the evolution by accretion of water-rich outer planetary embryos. Following the distribution of water proposed in Sect. 2, our simulations produce planets with very different water contents. On the one hand, one of the four planets surviving in the HZ is a dry world. In fact, this planet ends the simulation with 0.138 M⊕ and with no water since it is impacted only by planetary embryos formed inside the snow line during its evolution. On the other hand, the other three planets of the HZ with masses of 0.072 M⊕, 0.127 M⊕, and 0.133 M⊕ present final water contents of 5.9% (15.2 EOs), 28.6% (129.7 EOs), and 16.7% (79.3 EOs) by mass, respectively. The water delivery on the 0.072 M⊕ planet turns out to be a late process in its evolutionary history. In fact, the total water content of this planet is provided by the last giant impact at 11.3 Myr. On the contrary, the water delivery on the 0.133 M⊕ planet is an early process in its evolution. This planet acquires 77% of its final water content at 6 Myr, while the last giant impact is experienced at 57.7 Myr. Finally, the 0.127 M⊕ planet acquires 50% of its final water content at 3 Myr, while the other 50% is provided by the last giant impact at 8.3 Myr.
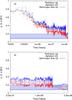 |
Fig. 7 Evolution in time of the semimajor axis (black) and the perihelion (red) and aphelion (blue) distances for the planet of the HZ in the Class 2 system resulting from a 0.029 M⊙ disk around a M3-type star. The bottom panel shows a zoom of the evolution of the planet during the last 150 Myr. The blue and light blue shaded areas represent the conservative and optimistic HZ, respectively. |
The physical properties of the planets surviving in the HZ in this scenario allows us to suggest some considerations about their potential habitability. In general terms, the most important condition required for a planet to be habitable is the permanent presence of liquid water on its surface. However, the maintenance of habitable conditions on a planet requires other conditions to be satisfied; some of these conditions are related to the existence of suitable atmospheric properties, such as the magnetic field and plate tectonics that replenish the atmosphere of CO2. In these simulations, the Mars-mass planets formed in the HZ would seem too small to satisfy such requirements. In fact, the smaller planets could develop a much thicker stratification as a result of partial melting in the hot upwelling mantle because under reduced gravity and pressure conditions the solidus and liquidus pressures correspond to greater depths (Schott et al. 2001). Such a thicker stratification is more buoyant, and therefore, it is possible to predict that plate tectonics is more difficult on small planetary bodies. In the same way, the generation and preservation of a magnetic field over a long timescale would also seem to be difficult for small planets. In fact, smaller bodies cool more rapidly and are therefore more likely to have metallic cores that do not stay in liquid form for very long. Thus, a small planet could not have a dynamo sufficient to produce a magnetic field over a long timescale. Moreover, a small planetary body with low escape velocity that is devoid of a magnetic field is not able to efficiently retain a substantial and long-lived atmosphere.
However, current Earth-like surface conditions may have prevailed during the earlier evolution of Mars (Baker 2001). In fact, crustal magnetization in the Southern Highlands (Acuna et al. 1999) requires the existence of a dynamo on early Mars (Nimmo & Stevenson 2000), suggesting plate-tectonics in early Martian history (Sleep 1994; Lenardic et al. 2004). Moreover, morphological features strongly reminiscent of flow channels suggest that liquid water may have been present on the surface in the early history of Mars (Jakosky & Phillips 2001). Thus, the Mars-mass planets formed in our simulations could maintain habitable conditions during their early histories.
5.3. Simulations with 0.029 M⊙ disks
In this working scenario, two out of ten simulations form one planet in the inner region to the snow line with masses of 0.8 M⊕ and 1 M⊕. In addition, 0.52 M⊕–1.7 M⊕ planets are produced beyond the snow line in all simulations.
In particular, one of ten simulations produces a planet associated with the HZ, which corresponds to a Class 2 system. Figure 7a shows the evolution of the semimajor axis, and the perihelion and aphelion distances of the planet surviving in the HZ. This planet starts the simulation beyond the snow line, which is located at 0.26 AU. From the beginning, the planet migrates significantly owing to interactions with planetary embryos. At 138.1 Myr, the planet is strongly perturbed by the impact of an embryo, which leads to a sharp decrease in its semimajor axis. Until the end of the simulation, the semimajor axis and the perihelion distance of the orbit of the planet evolve into the HZ, while the aphelion distance oscillates reaching values larger than the outer edge of such a region. This can be seen in Fig. 7b, which shows a zoom of evolution of the planet during the last 150 Myr; the eccentricity of this planet has a maximum value of 0.3. According Eq. (8), the time-averaged incident stellar flux is up to 5% higher than the effective flux from circular orbit. As we have already mentioned, this may help the eccentric planet that is located near the outer edge of the HZ maintain habitable conditions. This planet survives in the HZ with the mean values of eccentricity and inclination of 0.28 and 14°, respectively, which have been computed over the last 10 Myr of evolution. These parameters are illustrated in Fig. 4 as a blue open circle.
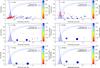 |
Fig. 8 Evolution in time of a simulation corresponding to a 0.025 M⊙ disk around a M0-type star. Planetary embryos are plotted as circles following the color scale that represents the fraction of water with respect to their total masses. The blue and light blue shaded areas represent the conservative and optimistic HZ, respectively. Moreover, the blue and light blue curves represent curves of constant perihelion and aphelion, both for the conservative and optimistic HZ. In this case, a planet is formed in the HZ with a mass of 0.28 M⊕ and a water content of 26.7% by mass, which is equal to 267 EOs. |
The planet surviving in the HZ starts the simulation with 0.14 M⊕ and ends with 1.03 M⊕ after 200 Myr of evolution. It is worth noting that, ~80 % of its final mass comes from beyond the snow line, while the remaining mass corresponds to accreted material from the inner region.
The last giant impact experienced by this planet occurs at 138.1 Myr after the gaseous component dissipation. According our discussion in the previous section, the formation of this planet requires a timescale that is longer than that associated with the Earth (Jacobson et al. 2014).
The planet that is formed in the HZ starts the simulation beyond the snow line. Thus, such a planet has a significant primordial water content. Following the distribution of water proposed in Sect. 2., this planet starts the simulation with 0.14 M⊕ and a primordial water content of 75% by mass, which is equal to 375 EOs. After 200 Myr of evolution, this planet survives in the HZ with 1.03 M⊕ and a final water content of 60.6% by mass, which equals 2229.2 EOs. The water delivery on this planet is an early process in its evolutionary history. In fact, this planet acquires 76% of its final water content at 6.3 Myr, while the last giant impact is experienced at 138.1 Myr.
The physical properties of the planet of the HZ suggest that it should be able to maintain habitable conditions over a very long timescale.
6. General results for M0-type stars
Here, we study the process of planetary formation and water delivery around M0-type stars, assuming protoplanetary disks of 0.025 M⊙ and 0.05 M⊕.
6.1. Simulations with 0.025 M⊙ disks
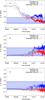 |
Fig. 9 Evolution in time of the semimajor axis (black), and the perihelion (red) and the aphelion (blue) distances for three planets associated with the HZ that correspond to systems of Class 1 (a), Class 2 (b), and Class 3 (c), for a 0.025 M⊙ disk around a M0-type star. The blue and light blue shaded areas represent the conservative and optimistic HZ, respectively. |
Figure 8 shows six snapshots in time on the semimajor axis-eccentricity plane of the evolution of a given simulation that considers a 0.025 M⊙ disk around a M0-type star. In general terms, the overall progression of all the simulations developed in this scenario is similar to that described for a 0.0145 M⊙ disk around a M3-type star. From the beginning, the planetary embryos are quickly excited by their own mutual gravitational perturbations. From this, the orbital eccentricities of embryos increase until their orbits cross and accretion giant impacts occur. Then, planetary embryos grow by accretion of other embryos, leading to formation of planets on stable orbits. In particular, the simulation shown in Fig. 8 produces a planet in the HZ with a mass of 0.28 M⊕ and a final water content of 26.7% by mass, which is equal to 267 EOs.
In general terms, each simulation forms one two to planets in the inner region to the snow line with a mass ranging between 0.16 M⊕ and 0.87 M⊕. On the other hand, in each simulation, two to three planets are produced beyond the snow line with masses between 0.18 M⊕ and 1.42 M⊕.
For the 0.025 M⊙ disk, we obtain one system of interest of Class 1 and another one associated with Class 2. Moreover, our simulations form six systems corresponding to Class 3, and two systems associated with Class 4.
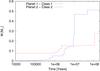 |
Fig. 10 Evolution of mass of the planets surviving in the HZ for a 0.025 M⊙ disk around a M0-type star. |
Figure 9 shows the evolution in time of the semimajor axis, and the perihelion and aphelion distances of the planet associated with the HZ in systems of Class 1 a), Class 2 b), and Class 3 c). In particular, Fig. 9a shows the evolution of the planet surviving in the HZ in the Class 1 system. This planet starts the simulation beyond the snow line, which is located at 0.51 AU. From the beginning, the planet undergoes a significant migration due to interactions with planetary embryos. At 5 Myr, the semimajor axis and the perihelion distance of the planet start to evolve into the HZ, but the aphelion distance oscillates reaching maximum values that are larger than the outer edge of the HZ. However, at 100 Myr, the semimajor axis of the planet decreases sharply due to an accretion collision by a planetary embryo. From this, the planet evolves until the end of the simulation with its orbit fully contained in the HZ. On the other hand, the evolution of the planet associated with the HZ in the Class 2 system is shown in Fig. 9b. From the beginning, this planet evolves inside the HZ, migrating outwards owing to interactions with embryos of the system. At 10 Myr, the semimajor axis of the planet shows a significant change from an impact experienced with a planetary embryo. Until the end of the simulation, the planet evolves on an orbit whose semimajor axis does not change significantly, while its eccentricity shows large oscillations, reaching a maximum value of 0.45. Thus, the perihelion distance of the planet’s orbit evolves within the edges of the HZ, and the aphelion distance oscillates reaching maximum values that are larger than the outer edge of such region. Considering Eq. (8), the time-averaged incident stellar flux is up to 12% higher than the effective flux from circular orbit. As we have already mentioned, this may help the eccentric planet near the outer edge of the HZ maintain habitable conditions. Finally, Fig. 9c shows the evolution of the planet surviving in the HZ in a Class 3 system. This planet starts the simulation with its orbit fully contained in the HZ. However, after 200 Myr, its semimajor axis evolves within the limits of the HZ but its perihelion distance oscillates, reaching values that are less than the inner edge of such region. Thus, such a planet will be too hot to develop habitable conditions. The values of the eccentricity and inclination of the planets remaining in the HZ for this particular disk are illustrated as red filled circles in Fig. 4. These points represent mean values computed over the last 10 Myr of evolution. These planets have mean eccentricities of 0.1 and 0.27 and mean inclinations of 20.6° and 25.4°.
As we mentioned, our simulations produce two planets of relevant interest in the HZ; one of these belongs to a system of Class 1 and the other one is associated with a Class 2 system. Figure 10 represents the mass of the two planets surviving in the HZ as a function of time. On the one hand, the planet associated with the Class 1 system has a final mass of 0.28 M⊕ and experiences the last giant impact at 110 Myr after the gas dissipation, which represents a timescale comparable to the formation time of the Earth (Jacobson et al. 2014). We note that 39% of the final mass comes from beyond the snow line, and the remaining mass corresponds to accreted material from the inner region. On the other hand, the final mass of the planet belonging to the Class 2 system is of 0.51 M⊕ and the last giant impact is experienced at 46.1 Myr after the gaseous component dissipation. However, the planet reaches 91% of its final mass from a giant impact experienced at 10 Myr. Following Jacobson et al. (2014), the formation of this planet represents an early process in comparison with the formation of the Earth. In this scenario, 64% of the final mass comes from beyond the snow line and the remaining mass corresponds to accreted material from the inner region.
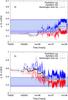 |
Fig. 11 Evolution in time of the semimajor axis (black), and the perihelion (red) and the aphelion (blue) distances for two planets associated with the HZ that correspond to systems of Class 1 (a), and Class 2 (b), for a 0.05 M⊙ disk around a M0-type star. The blue and light blue shaded areas represent the conservative and optimistic HZ, respectively. |
Both planets have different evolutionary histories related to the process of water delivery on them. First, the planet associated with the Class 1 system starts the simulation beyond the snow line and, from this, its primordial water content is of 75% by mass. The initial mass of this planet is of 0.078 M⊕ and its primordial water content is of 208.9 EOs. After 200 Myr of evolution, this planet ends with a mass of 0.28 M⊕ and a final water content of 26.7% by mass, which equals 267 EOs. The primordial water content of this planet represents 79% of its final water content. Thus, the water delivery turns out to be an early process in its evolutionary history. On the contrary, the planet associated with the Class 2 system starts the simulation inside the snow line. Thus, this planet does not have water at the beginning of the simulation. After 200 Myr, this planet survives in the HZ with 0.51 M⊕ and a final water content of 45.8% by mass, which is equal to 834.2 EOs. This planet acquires 92% of its final water content at 10 Myr, when a giant impact provides the planet 91% of its final mass. Thus, the water delivery turns out to be a late process in the evolution of this planet.
From the discussion developed in previous sections, the physical properties obtained for these planets surviving in the HZ suggest that they should be considered objects of astrobiological interest. At least, such planets should be able to maintain habitable conditions during their early histories. It would be interesting to determine if the subsized Earth planets formed in these simulations are capable of sustaining habitable conditions over very long timescales.
6.2. Simulations with 0.05 M⊙
In this working scenario, our simulations produce one planetary system of Class 1, another system of Class 2, and eight systems of Class 4.
Figure 11a shows the evolution in time of the semimajor axis a, and the perihelion q and aphelion Q distances of the planet surviving in the HZ in the Class 1 system. This planet starts the simulation on a low eccentricity orbit whose semimajor axis has a value less than the inner edge of the HZ. During the evolution, the orbital parameters of the planet are perturbed owing to gravitational interactions and collisions with planetary embryos. At the end of the simulation, the planet evolves on an orbit fully contained in the HZ. In the same way, Fig. 11b shows the evolution of the planet surviving in the HZ in the Class 2 system. This planet starts the simulation beyond the snow line and evolves towards inner regions of the disk due to gravitational perturbations and impacts with embryos. At 4 Myr, this planet experiences a collision with an embryo of the system, from which its semimajor axis evolves within the edges of the HZ. Until the end of the simulation, the aphelion distance of the planet oscillates beyond the outer edge of the HZ, while its perihelion distance shows large oscillations reaching values less than the inner edge of such region. After 90 Myr, the eccentricity of this planet oscillates reaching a maximum value of 0.55. From this, the perihelion distance evolves within the HZ. According Eq. (8), the time-averaged incident stellar flux is up to 20% higher than the effective flux from circular orbit. Such a planet located near of the outer edge of the HZ could be able to maintain habitable conditions with suitable physical properties. The values of the eccentricity and inclination of the planets surviving in the HZ for the disk under consideration are illustrated as red open circles in Fig. 4. Such points represent mean values computed over the last 10 Myr of evolution. These planets have mean eccentricities of 0.26 and mean inclinations of 10° and 27.7°.
In general terms, each simulation form one planet in the inner region to the snow line with a mass ranging between 0.72 M⊕ and 3.1 M⊕. On the other hand, in each simulation, one to two planets are produced beyond the snow line with masses between 1.3 M⊕ and 4.3 M⊕.
As we remarked, our simulations produce two planets of relevant interest in the HZ, one of which is associated with a system of Class 1 and the other one belongs to a Class 2 system. Figure 12 shows the evolution of the mass of the two planets surviving in the HZ as a function of time. First, the planet belonging to the Class 1 system has a mass of 1.42 M⊕ at the end of the simulation. Moreover, this planet experiences the last giant impact at 41 Myr after the gaseous component dissipation. Then, the planet associated with the Class 2 system has a final mass of 0.72 M⊕ and experiences the last giant impact at 4 Myr after the gas dissipation. The last giant impact provides more than 40% of the final mass of each planet. Finally, as we have already discussed referring to Jacobson et al. (2014), both planets have formation timescales shorter than those required by Earth.
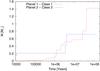 |
Fig. 12 Evolution of mass of the planets surviving in the HZ for a 0.05 M⊙ disk around an M0-type star. |
As for their water contents, the two planets surviving in the HZ show different features. On the one hand, the planet belonging to the Class 1 system starts the simulation inside the snow line, so that it does not have water in its primordial composition. After 200 Myr of evolution, this planet survives in the HZ with 1.42 M⊕ and 50.5% of water by mass, which equals 2561.1 EOs. The last giant impact experienced by this planet at 41 Myr provides 56% of its final water content. Thus, the water delivery on such a planet represents a late process in its evolutionary history. In this scenario, 10% of the final mass comes from beyond the snow line, and 90% of the final mass corresponds to accreted material from the inner region. On the other hand, the planet associated with the Class 2 system starts the simulation beyond the snow line, so that it has 75% of water by mass in its primordial composition. This planet has an initial mass of 0.15 M⊕ and a primordial water content of 401.8 EOs. At the end of the simulation, the planet survives in the HZ with a mass of 0.72 M⊕ and a water content of 68% by mass, which equals 1748.6 EOs. In this case, the primordial water content only represents 23% of the final water content of the planet. The last giant impact experienced by this planet at 4 Myr provides 46% of its final water content. From this, the water delivery on this planet is a late process in its evolution. In this scenario, 33% of the final mass comes from beyond the snow line, and 67% of the final mass corresponds to accreted material from the inner region.
Based on their physical properties, we believe that the planets surviving in the HZ in these simulations should be able to maintain habitable conditions for very long.
7. Discussion and conclusions
In the present work, we carried out N-body simulations aimed at studying the planetary formation process and water delivery around low-mass stars. In particular, we selected M3- and M0-type stars, which have 0.29 M⊙ and 0.5 M⊙, respectively. Moreover, we adopted massive protoplanetary disks, which were assumed to have masses with 5% and 10% of the mass of the central star. The present work primarily focused on the process of formation of terrestrial-like planets and water delivery in the HZ of such systems.
The present work allows us to extend the range of stellar targets of astrobiological interest derived by Raymond et al. (2007) towards lower masses. In fact, Raymond et al. (2007) suggested that stars with masses ≲0.6 M⊙ are likely to form small (≲0.3 M⊕) and dry planets in the HZ of the system. However, our study indicates that stars of 0.29 M⊙ and 0.5 M⊙ are able to produce planets in the HZ with a wide diversity of masses and water contents.
For M3-type stars, our simulations formed five planets in the HZ with very different physical properties. First, one of these planets is less massive than Mars with 0.072 M⊕ and a water content of 15.2 EOs. Second, two of the five planets formed in the HZ are more massive than Mars with ~0.13 M⊕ each and water contents of 79.3 EOs and 129.7 EOs. In the same way, one of the five planets surviving in the HZ is also more massive than Mars with 0.138 M⊕ but it is a dry world. Finally, the last planet formed in the HZ is an Earth-mass planet with 1.03 M⊕ and a water content of 2229.2 EOs. Our results suggest that M3-type stars should be considered targets of interest for the search of exoplanets in the HZ. On the one hand, Earth-mass planets with very high water contents should be detected around this type of stars. These planets are very interesting since they might be able to maintain habitable conditions over very long timescales. On the other hand, Mars-mass planets with very diverse water contents should also be discovered around M3-type stars. While these smaller planets would be only able to maintain habitable conditions in their early histories, we believe that they could represent a very interesting class of exoplanets. In fact, the search for candidates around young M3-type stars could lead to the detection of planets analogous to early Mars. The discovery of this type of exoplanets could help us to strengthen our understanding about the formation and evolution of Mars in our solar system.
For M0-type stars, our simulations produced four planets in the HZ with different masses and water contents. In fact, the planets surviving in the HZ have masses of 0.28 M⊕, 0.51 M⊕, 0.72 M⊕, and 1.42 M⊕, and water contents of 267 EOs, 834.2 EOs, 1748.6 EOs, and 2561.1 EOs, respectively. According to our discussions throughout this work, we believe that these planets should be able to maintain habitable conditions for very long. Thus, because of their abundance in the galaxy and the results derived in our simulations, we suggest that M0-type stars should be considered targets of significant interest for the search of exoplanets in the HZ.
The semi-analytical model and the N-body code used in the present study have limitations that must be mentioned. On the one hand, the effect of gaseous envelopes on the planetary embryos is neglected in the semi-analytical model. However, at the end of the gaseous phase the most massive embryo of all our simulations has ~1 M⊕. Thus, such an approximation should not produce significant differences in our results. In the same way, the semi-analytical model does not consider the effects of the type I migration on the planetary embryos. In fact, we believe that many quantitative aspects of such an effect are still uncertain and complex, and owing to that, we decided not to take it into account in our simulations. On the other hand, the semi-analytical model does not include the process of planetesimal fragmentation or pebble accretion in the evolution of disk. Guilera et al. (2014) showed that the planetesimal fragmentation could significantly modify the process of planetary formation. Moreover, several authors have recently proposed an alternative model in which the cores of gaseous giants and terrestrial planets could be formed as seeds that accrete small particles, often called pebbles. Ormel & Klahr (2010), Lambrechts & Johansen (2012), and Levison et al. (2015) showed that pebbles, which are strongly coupled to the gas, could be accreted very efficiently to form planetary bodies. In the present study, the semi-analytical model assumes only one species of planetesimals with a classical size of 10 km radius in the beginning of the simulations. If the planetesimal population was composed by species of different sizes and the planetesimal fragmentation and pebble accretion were taken into account, the distribution of planetary embryos and the solid surface density profile could suffer modifications at the end of the gaseous phase. However, to study the sensitivity of the planetary systems formed in our simulations to the planetesimal population is beyond the scope of this work.
The N-body MERCURY code also has some limitations that should be considered. On the one hand, collisions between planetary embryos are treated as inelastic mergers, which conserve the total mass and water content. In fact, we do not account for mass and water losses during impacts so that the final mass and water contents of the resulting planets are upper limits. Chambers (2013) developed an improved N-body code, which includes fragmentation and hit-and-run collisions rather than assuming that all impacts lead to a perfect merger of the colliding bodies. This model is based on hydrodynamical simulations of planetary impacts performed by Leinhardt & Stewart (2012) and Genda et al. (2012), which allows us to identify boundaries of different collisional regimes. Chambers (2013) developed a set of N-body simulations of planetary formation including fragmentation and hit-and-run collisions and then, he compared them to simulations in which all collisions were treated as inelastic mergers. In general terms, both sets of simulations showed similar results. However, Chambers (2013) evidenced some differences related to the masses and the time-averaged eccentricities of the final planets. We believe that a more realistic treatment of the collisions should be included in future N-body simulations. Such improvements will allow us to determine the orbital and physical properties of the planets formed in the simulations in greater detail. On the other hand, Marcus et al. (2010) presented results from smoothed particle hydrodynamics simulations of impacts between differentiated water(ice)-rock planets. From this, the authors analyzed the effects of late giant impacts on the final bulk abundance of water in super-Earths. Marcus et al. (2010) derived general laws, which should be incorporated into future N-body calculations of planet formation to track the composition of growing planets in more detail.
In the present work, we consider a snow line with a fixed position for each star. However, several works such as Ramirez & Kaltenegger (2014) and Tian (2015), calculated how the orbital distance of the HZ and the position of the snow line change throughout the pre-main-sequence (PMS) stage of the host star. In particular, for a 0.5 M⊙ star, Ramirez & Kaltenegger (2014) found that the snow line in the PMS moves inwards in the protoplanetary disk from 2 AU to 0.5 AU in a period of 200 Myr. Regardless of star type, all planets located at the inner edge of the main-sequence (MS) HZ receive stellar fluxes that exceed the runaway greenhouse threshold for at least part of the PMS stage, which results in the rapid evaporation of surface water. Triggering a runaway greenhouse does not ensure that a planet could not later become habitable because water could recondense afterwards. Planets orbiting at distances corresponding to the inner and outer MS HZ around a 0.5 M⊙ star would lose up to 25 EOs and 0.5 EOs, respectively, and about 0.1 EOs are lost at the MS snow line. Assuming that a HZ and a snow line evolving in time may lead to changes in the final results obtained in the present work. Future works based on N-body simulations should incorporate such effects to test the sensitivity of the results concerning the physical and dynamical properties of the HZ planets.
It is also important to note that all our simulations were integrated for 150–200 Myr. Thus, the planetary systems obtained in the present work should be treated as systems of potential interest. It would be very interesting to analyze the long-period dynamical stability of the planets surviving in the HZ to clarify the distribution of these kind of exoplanets around low-mass stars.
We believe that the results obtained in the present work lead to a better understanding about the planetary formation processes around M3- and M0-type stars in systems without gas giants. Future observational evidence will be necessary to test our theoretical models and to strengthen our knowledge about the population of terrestrial-like planets around low-mass stars.
Acknowledgments
This work was partially financed by CONICET by grant PIP 0436/13. We thank Dr. Mauro Spagnuolo for helping us to improve the manuscript. Finally, we thank the referee, John Chambers, for valuable suggestions that helped us improve the manuscript.
References
- Acuna, M. H., Connerney, J. E. P., Ness, N. F., et al. 1999, Science, 284, 790 [NASA ADS] [CrossRef] [PubMed] [Google Scholar]
- Alibert, Y., Mousis, O., Mordasini, C., & Benz, W. 2005, ApJ, 626, L57 [NASA ADS] [CrossRef] [Google Scholar]
- Andrews, S. M., Wilner, D. J., Hughes, A. M., Qi, C., & Dullemond, C. P. 2010, ApJ, 723, 1241 [NASA ADS] [CrossRef] [Google Scholar]
- Baker, V. R. 2001, Nature, 412, 228 [NASA ADS] [CrossRef] [Google Scholar]
- Benítez-Llambay, P., Masset, F., Koenigsberger, G., & Szulágyi, J. 2015, Nature, 520, 63 [NASA ADS] [CrossRef] [Google Scholar]
- Bibring, J.-P., Langevin, Y., Mustard, J. F., et al. 2006, Science, 312, 400 [NASA ADS] [CrossRef] [PubMed] [Google Scholar]
- Brunini, A., & Benvenuto, O. G. 2008, Icarus, 194, 800 [NASA ADS] [CrossRef] [Google Scholar]
- Chambers, J. 2008, Icarus, 198, 256 [NASA ADS] [CrossRef] [Google Scholar]
- Chambers, J. E. 1999, MNRAS, 304, 793 [NASA ADS] [CrossRef] [MathSciNet] [Google Scholar]
- Chambers, J. E. 2013, Icarus, 224, 43 [NASA ADS] [CrossRef] [Google Scholar]
- Dauphas, N., & Pourmand, A. 2011, Nature, 473, 489 [NASA ADS] [CrossRef] [PubMed] [Google Scholar]
- de Elía, G. C., Guilera, O. M., & Brunini, A. 2013, A&A, 557, A42 [NASA ADS] [CrossRef] [EDP Sciences] [Google Scholar]
- Fortier, A., Benvenuto, O. G., & Brunini, A. 2009, A&A, 500, 1249 [NASA ADS] [CrossRef] [EDP Sciences] [Google Scholar]
- Genda, H., Kokubo, E., & Ida, S. 2012, ApJ, 744, 137 [NASA ADS] [CrossRef] [Google Scholar]
- Guilera, O. M., Brunini, A., & Benvenuto, O. G. 2010, A&A, 521, A50 [NASA ADS] [CrossRef] [EDP Sciences] [Google Scholar]
- Guilera, O. M., de Elía, G. C., Brunini, A., & Santamaría, P. J. 2014, A&A, 565, A96 [NASA ADS] [CrossRef] [EDP Sciences] [Google Scholar]
- Guilet, J., Baruteau, C., & Papaloizou, J. C. B. 2013, MNRAS, 430, 1764 [NASA ADS] [CrossRef] [Google Scholar]
- Hartmann, L., Calvet, N., Gullbring, E., & D’Alessio, P. 1998, ApJ, 495, 385 [NASA ADS] [CrossRef] [Google Scholar]
- Hayashi, C. 1981, Progr. Theor. Phys. Suppl., 70, 35 [Google Scholar]
- Henry, T. J. 2004, in Spectroscopically and Spatially Resolving the Components of the Close Binary Stars, eds. R. W. Hilditch, H. Hensberge, & K. Pavlovski, ASP Conf. Ser., 318, 159 [Google Scholar]
- Ida, S., & Lin, D. N. C. 2004, ApJ, 604, 388 [NASA ADS] [CrossRef] [PubMed] [Google Scholar]
- Ida, S., & Lin, D. N. C. 2008, ApJ, 673, 487 [NASA ADS] [CrossRef] [Google Scholar]
- Ida, S., & Makino, J. 1993, Icarus, 106, 210 [NASA ADS] [CrossRef] [MathSciNet] [Google Scholar]
- Inaba, S., Tanaka, H., Nakazawa, K., Wetherill, G. W., & Kokubo, E. 2001, Icarus, 149, 235 [NASA ADS] [CrossRef] [Google Scholar]
- Jacobson, S. A., Morbidelli, A., Raymond, S. N., et al. 2014, Nature, 508, 84 [NASA ADS] [CrossRef] [Google Scholar]
- Jakosky, B. M., & Phillips, R. J. 2001, Nature, 412, 237 [NASA ADS] [CrossRef] [Google Scholar]
- Kley, W., & Crida, A. 2008, A&A, 487, L9 [NASA ADS] [CrossRef] [EDP Sciences] [Google Scholar]
- Kopparapu, R. K., Ramirez, R., Kasting, J. F., et al. 2013a, ApJ, 770, 82 [NASA ADS] [CrossRef] [Google Scholar]
- Kopparapu, R. K., Ramirez, R., Kasting, J. F., et al. 2013b, ApJ, 765, 131 [NASA ADS] [CrossRef] [Google Scholar]
- Lambrechts, M., & Johansen, A. 2012, A&A, 544, A32 [Google Scholar]
- Leinhardt, Z. M., & Stewart, S. T. 2012, ApJ, 745, 79 [NASA ADS] [CrossRef] [Google Scholar]
- Lenardic, A., Nimmo, F., & Moresi, L. 2004, J. Geophys. Res., 109, E02003 [NASA ADS] [CrossRef] [Google Scholar]
- Levison, H. F., Kretke, K. A., & Duncan, M. J. 2015, Nature, 524, 322 [CrossRef] [Google Scholar]
- Lodders, K. 2003, ApJ, 591, 1220 [NASA ADS] [CrossRef] [Google Scholar]
- Lynden-Bell, D., & Pringle, J. E. 1974, MNRAS, 168, 603 [NASA ADS] [CrossRef] [Google Scholar]
- Mamajek, E. E. 2009, in AIP Conf. Ser. 1158, eds. T. Usuda, M. Tamura, & M. Ishii, 3 [Google Scholar]
- Marcus, R. A., Sasselov, D., Stewart, S. T., & Hernquist, L. 2010, ApJ, 719, L45 [NASA ADS] [CrossRef] [Google Scholar]
- Marty, B. 2012, Earth Planet. Sci. Lett., 313, 56 [NASA ADS] [CrossRef] [Google Scholar]
- Miguel, Y., Guilera, O. M., & Brunini, A. 2011a, MNRAS, 417, 314 [CrossRef] [Google Scholar]
- Miguel, Y., Guilera, O. M., & Brunini, A. 2011b, MNRAS, 412, 2113 [NASA ADS] [CrossRef] [Google Scholar]
- Mizuno, H. 1980, Prog. Theor. Phys., 64, 544 [Google Scholar]
- Montgomery, R., & Laughlin, G. 2009, Icarus, 202, 1 [NASA ADS] [CrossRef] [Google Scholar]
- Nimmo, F., & Stevenson, D. J. 2000, J. Geophys. Res., 105, 11969 [NASA ADS] [CrossRef] [Google Scholar]
- Ogihara, M., & Ida, S. 2009, ApJ, 699, 824 [NASA ADS] [CrossRef] [Google Scholar]
- Ohtsuki, K., Stewart, G. R., & Ida, S. 2002, Icarus, 155, 436 [NASA ADS] [CrossRef] [MathSciNet] [Google Scholar]
- Ormel, C. W., & Klahr, H. H. 2010, A&A, 520, A43 [NASA ADS] [CrossRef] [EDP Sciences] [Google Scholar]
- Paardekooper, S.-J., Baruteau, C., Crida, A., & Kley, W. 2010, MNRAS, 401, 1950 [NASA ADS] [CrossRef] [Google Scholar]
- Paardekooper, S.-J., Baruteau, C., & Kley, W. 2011, MNRAS, 410, 293 [NASA ADS] [CrossRef] [Google Scholar]
- Pollack, J. B., Kasting, J. F., Richardson, S. M., & Poliakoff, K. 1987, Icarus, 71, 203 [NASA ADS] [CrossRef] [Google Scholar]
- Pollack, J. B., Hubickyj, O., Bodenheimer, P., et al. 1996, Icarus, 124, 62 [NASA ADS] [CrossRef] [Google Scholar]
- Rafikov, R. R. 2004, AJ, 128, 1348 [NASA ADS] [CrossRef] [Google Scholar]
- Ramirez, R. M., & Kaltenegger, L. 2014, ApJ, 797, L25 [NASA ADS] [CrossRef] [Google Scholar]
- Raymond, S. N., O’Brien, D. P., Morbidelli, A., & Kaib, N. A. 2009, Icarus, 203, 644 [NASA ADS] [CrossRef] [Google Scholar]
- Raymond, S. N., Scalo, J., & Meadows, V. S. 2007, ApJ, 669, 606 [Google Scholar]
- Scalo, J., Kaltenegger, L., Segura, A. G., et al. 2007, Astrobiology, 7, 85 [NASA ADS] [CrossRef] [PubMed] [Google Scholar]
- Schott, B., van den Berg, A. P., & Yuen, D. A. 2001, Geophys. Res. Lett., 28, 4271 [NASA ADS] [CrossRef] [Google Scholar]
- Sleep, N. H. 1994, J. Geophys. Res., 99, 5 [Google Scholar]
- Solomon, S. C., & Head, J. W. 1991, Science, 252, 252 [NASA ADS] [CrossRef] [Google Scholar]
- Tanaka, H., Takeuchi, T., & Ward, W. R. 2002, ApJ, 565, 1257 [NASA ADS] [CrossRef] [Google Scholar]
- Tarter, J. C., Backus, P. R., Mancinelli, R. L., et al. 2007, Astrobiology, 7, 30 [NASA ADS] [CrossRef] [PubMed] [Google Scholar]
- Tian, F. 2015, Icarus, 258, 50 [NASA ADS] [CrossRef] [Google Scholar]
- Toomre, A. 1974, in The Formation and Dynamics of Galaxies, ed. J. R. Shakeshaft, IAU Symp., 58, 347 [Google Scholar]
- Touboul, M., Kleine, T., Bourdon, B., Palme, H., & Wieler, R. 2007, Nature, 450, 1206 [NASA ADS] [CrossRef] [PubMed] [Google Scholar]
- Williams, D. M., & Pollard, D. 2002, Int. J. Astrobiol., 1, 61 [NASA ADS] [CrossRef] [Google Scholar]
All Figures
|
Fig. 1 Distribution of embryos and planetesimals for disks of 0.0145 M⊙ and 0.029 M⊙ around a M3-type star at the end of the gaseous phase. Top panels: mass distributions of planetary embryos as a function of the distance from the central star. The color palette indicates the fraction of initial water for the embryos. Bottom panels: surface density profiles of planetesimals for each disk under consideration. |
| In the text | |
|
Fig. 2 Distribution of embryos and planetesimals for disks of 0.025 M⊙ and 0.05 M⊙ around a M0-type star at the end of the gaseous phase. Top panels: mass distributions of planetary embryos as a function of the distance from the central star. The color palette indicates the fraction of initial water for the embryos. Bottom panels: surface density profiles of planetesimals for each disk under consideration. |
| In the text | |
|
Fig. 3 Evolution in time of a simulation corresponding to a 0.0145 M⊙ disk around a M3-type star. Planetary embryos are plotted as circles following the color scale, which represents the fraction of water with respect to their total masses. The blue and light blue shaded areas represent the conservative and optimistic HZ, respectively. Moreover, the blue and light blue curves represent curves of constant perihelion and aphelion, both for the conservative and optimistic HZ. In this case, a planet survives in the HZ with a mass of 0.133 M⊕ and a water content of 16.7% by mass, which is equal to 79.3 EOs. |
| In the text | |
|
Fig. 4 Mean values of the eccentricity and inclination of the planets formed in the HZ over the last 10 Myr of evolution for each disk studied in this work. On the one hand, filled and open blue circles correspond to the disks of 0.0145 M⊙ and 0.029 M⊙, respectively. On the other hand, filled and open red circles are associated with the 0.025 M⊙ and 0.05 M⊙ disks, respectively. |
| In the text | |
|
Fig. 5 Evolution in time of the semimajor axis (black), and the perihelion (red) and the aphelion (blue) distances for three planets associated with the HZ that correspond to systems of Class 1 (a), Class 2 (b), and Class 3 (c), for a 0.0145 M⊙ disk around a M3-type star. The blue and light blue shaded areas represent the conservative and optimistic HZ, respectively. |
| In the text | |
|
Fig. 6 Evolution of mass of the planets surviving in the HZ for a 0.0145 M⊙ disk around a M3-type star. |
| In the text | |
|
Fig. 7 Evolution in time of the semimajor axis (black) and the perihelion (red) and aphelion (blue) distances for the planet of the HZ in the Class 2 system resulting from a 0.029 M⊙ disk around a M3-type star. The bottom panel shows a zoom of the evolution of the planet during the last 150 Myr. The blue and light blue shaded areas represent the conservative and optimistic HZ, respectively. |
| In the text | |
|
Fig. 8 Evolution in time of a simulation corresponding to a 0.025 M⊙ disk around a M0-type star. Planetary embryos are plotted as circles following the color scale that represents the fraction of water with respect to their total masses. The blue and light blue shaded areas represent the conservative and optimistic HZ, respectively. Moreover, the blue and light blue curves represent curves of constant perihelion and aphelion, both for the conservative and optimistic HZ. In this case, a planet is formed in the HZ with a mass of 0.28 M⊕ and a water content of 26.7% by mass, which is equal to 267 EOs. |
| In the text | |
|
Fig. 9 Evolution in time of the semimajor axis (black), and the perihelion (red) and the aphelion (blue) distances for three planets associated with the HZ that correspond to systems of Class 1 (a), Class 2 (b), and Class 3 (c), for a 0.025 M⊙ disk around a M0-type star. The blue and light blue shaded areas represent the conservative and optimistic HZ, respectively. |
| In the text | |
|
Fig. 10 Evolution of mass of the planets surviving in the HZ for a 0.025 M⊙ disk around a M0-type star. |
| In the text | |
|
Fig. 11 Evolution in time of the semimajor axis (black), and the perihelion (red) and the aphelion (blue) distances for two planets associated with the HZ that correspond to systems of Class 1 (a), and Class 2 (b), for a 0.05 M⊙ disk around a M0-type star. The blue and light blue shaded areas represent the conservative and optimistic HZ, respectively. |
| In the text | |
|
Fig. 12 Evolution of mass of the planets surviving in the HZ for a 0.05 M⊙ disk around an M0-type star. |
| In the text | |
Current usage metrics show cumulative count of Article Views (full-text article views including HTML views, PDF and ePub downloads, according to the available data) and Abstracts Views on Vision4Press platform.
Data correspond to usage on the plateform after 2015. The current usage metrics is available 48-96 hours after online publication and is updated daily on week days.
Initial download of the metrics may take a while.