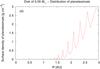
Fig. 2
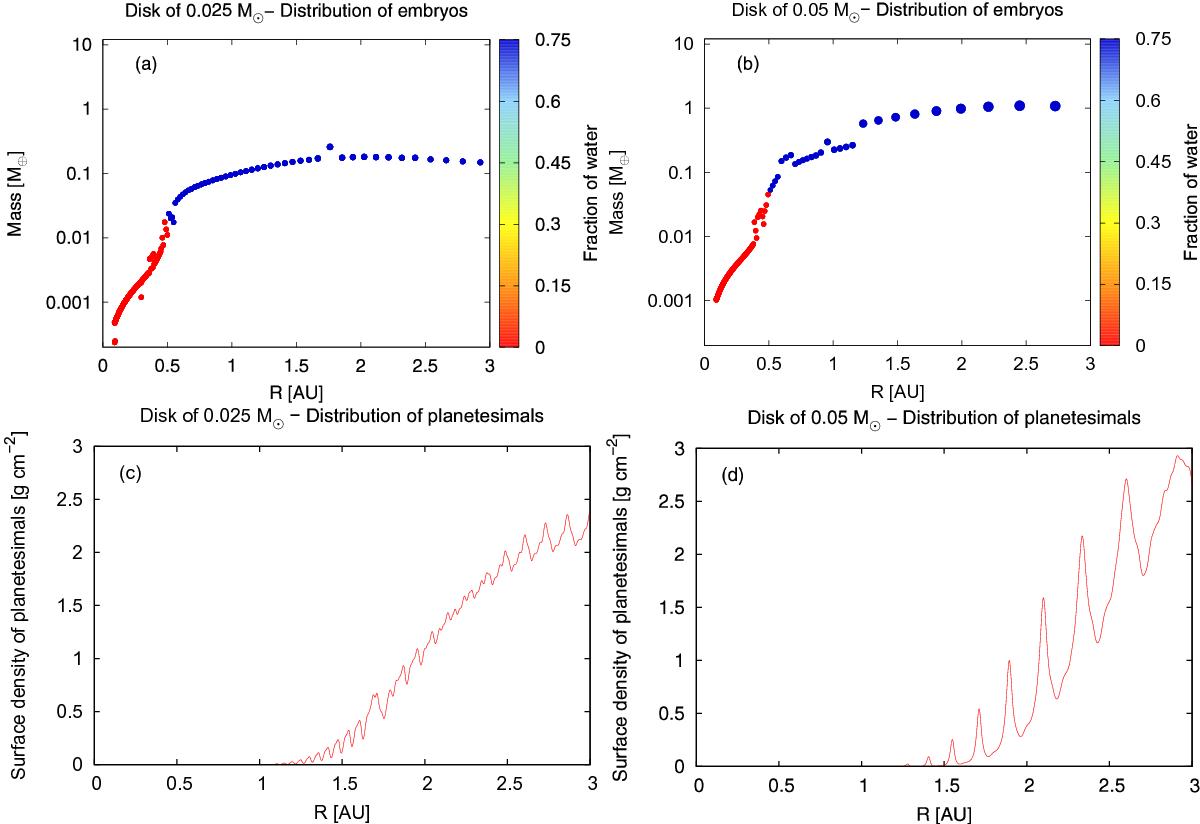
Distribution of embryos and planetesimals for disks of 0.025 M⊙ and 0.05 M⊙ around a M0-type star at the end of the gaseous phase. Top panels: mass distributions of planetary embryos as a function of the distance from the central star. The color palette indicates the fraction of initial water for the embryos. Bottom panels: surface density profiles of planetesimals for each disk under consideration.
Current usage metrics show cumulative count of Article Views (full-text article views including HTML views, PDF and ePub downloads, according to the available data) and Abstracts Views on Vision4Press platform.
Data correspond to usage on the plateform after 2015. The current usage metrics is available 48-96 hours after online publication and is updated daily on week days.
Initial download of the metrics may take a while.