| Issue |
A&A
Volume 596, December 2016
|
|
|---|---|---|
| Article Number | A86 | |
| Number of page(s) | 12 | |
| Section | Extragalactic astronomy | |
| DOI | https://doi.org/10.1051/0004-6361/201628162 | |
| Published online | 06 December 2016 | |
Study of galaxies in the Lynx-Cancer void
VI. H I-observations with Nançay Radio Telescope⋆
1 GEPI, Observatoire de
Paris, Place Jules
Janssen, 92195
Meudon,
France
2 Special Astrophysical Observatory of
RAS, Nizhnij
Arkhyz, 369167
Karachai-Circassia,
Russia
e-mail: sap@sao.ru
3 GEPI, Observatoire de Paris, PSL
Research University, CNRS, Univ
Paris Diderot, Sorbonne Paris Cité, Place Jules Janssen,
92195
Meudon,
France
4 Station de Radioastronomie de Nançay,
Observatoire de Paris, CNRS, 18330
Nançay,
France
Received:
19
January
2016
Accepted:
26
July
2016
Context. Void population consists mainly of late-type and low surface brightness (LSB) dwarf galaxies, whose atomic hydrogen is the main component of their baryonic matter. Therefore observations of void galaxy Hi are mandatory to understand both their evolution and dynamics.
Aims. Our aim was to obtain integrated Hi parameters for a fainter part of the nearby Lynx-Cancer void galaxy sample (total of 45 objects) with the Nançay Radio Telescope (NRT) and to conduct the comparative analysis of the whole 103 void galaxies with known Hi data with a sample of similar galaxies residing in denser environments of the Local Volume.
Methods. For Hi observations we used the NRT with its sensitive antenna/receiver system FORT and standard processing. The comparison of the void and “control” samples on the parameter M(HI)/LB is conducted with the non-parametric method “The 2 × 2 Contingency Table test”.
Results. We obtained new Hi data for about 40% of the Lynx-Cancer galaxy sample. Along with data from the literature, we use for further analysis data for 103 void objects. The proxy of the evolutional parameter M(HI)/LB of the void sample is compared with that of 82 galaxies of morphological types 8–10 residing in the Local Volume groups and aggregates.
Conclusions. At the confidence level of P = 0.988, we conclude that for the same luminosity, these void galaxies are systematically gas-richer, in average by ~39%. This result is consistent with the authors’ earlier conclusion on the smaller gas metallicities and evidences for the slower low-mass galaxy evolution in voids.
Key words: galaxies: dwarf / galaxies: evolution / galaxies: distances and redshifts / large-scale structure of Universe / radio lines: galaxies
The reduced spectra (FITS files) are only available at the CDS via anonymous ftp to cdsarc.u-strasbg.fr (130.79.128.5) or via http://cdsarc.u-strasbg.fr/viz-bin/qcat?J/A+A/596/A86
© ESO, 2016
1. Introduction
Low-mass galaxies are thought to be the most fragile with respect to both internal and external perturbations of various origin (interactions, inflows, mergers) (e.g., Dekel & Silk 1986; Babul & Rees 1992). Therefore it is expected that their evolution is most sensitive to various kinds of galaxy collisions (e.g., distant tidals, close pass-byes, major and minor mergers). Thus, it may significantly depend on the mean galaxy number density of various classes of the Large-Scale structure. Indeed, the strongest effects of dense environment on low-mass galaxy properties are found in galaxy clusters (e.g., Boselli et al. 2014, and references therein). In this scheme, if external perturbations play a substantial role in the secular evolution of typical dwarf galaxies, one expects that at least the part of the dwarf galaxies located in voids could be less evolved objects.
Besides, studies of gravitational instabilities in the cold dark matter cosmology indicate that low-mass haloes become bound later in the underdensity regions (low gravitational potential, e.g. Einasto et al. 2011). This is connected with the appearance of a bias in the gaussian peaks formalism for the structure formation (Bardeen et al. 1986; Dekel & Silk 1986). This, in turn, could also favor the appearance of less evolved low-mass galaxies in voids.
The study of galaxies in voids was quite popular during the last decade (Rojas et al. 2005; Patiri et al. 2006; Sorrentino et al. 2006; Kreckel et al. 2012; Beygu et al. 2012, among others), thanks to the emerging large sky surveys like the SDSS (Sloan Digital Sky Survey) and 2dFGRS (Two-degree field galaxy redshift survey). However, most of the studies of void galaxies mentioned above were mainly devoted to large and rather distant (D ≳ 80−100 Mpc) voids. This last choice, coupled with the demand of statistically complete galaxy samples (based on the apparent magnitude limit), limits the deepness of their void galaxy samples at the level of MB(Mr) ≲ −17.
Some differences between void and wall galaxies in this luminosity range have been noticed. Namely, void objects show higher proportion of blue galaxies and higher star formation rates (SFR) (e.g., Rojas et al. 2004; 2005; and Hoyle et al. 2005; 2012). Similar results were obtained in the recent cosmological simulations by Kreckel et al. (2011), which indicate that effect of global environment of voids and walls is rather subtle for more massive galaxies. They found however evidences that less massive objects in voids can show signs of evolutionary youth.
In order to address the issue of void environment effect on low-mass galaxy evolution (for galaxies below the adequate mass/luminosity limit – e.g., at MB ~ −12 or fainter), one needs to study samples of intrinsically faint objects. Having in mind the common apparent magnitude limits of the main wide-angle redshift surveys (equivalent to Btot ~ 18.0−18.5), this implies the necessety to study objects closer than ~20 Mpc, located in the nearby voids which are adjacent to the Local Volume.
In Pustilnik & Tepliakova (2011, Paper I) we described the large galaxy sample in the nearby Lynx-Cancer void (Dcentre ~ 18 Mpc) and presented their main known parameters. One of the tasks was to measure and analyze the evolutionary parameters of void galaxies: metallicity (or gas-phase O/H) and gas mass-fraction. In the published version, there are 79 galaxies with the absolute magnitudes MB in the range [−12, −18.4], with median of −14.0, and with the substantial incompleteness at the fainter luminosities. Roughly half of the void sample galaxies are Low Surface Brightness (LSB) galaxies, with extinction and inclination corrected central SB values of μ0,B,i ≥ 23.0m/Λ″.
In Papers II and VII (Pustilnik et al. 2011a, 2016), we present a study of O/H in 77 members of the Lynx-Cancer void sample. We compared the data with the parameter O/H of similar galaxies in denser environments. Void galaxies appear to have systematically lower O/H (by about ~37% in average) for the same luminosities. Other studies show that ~20% of void LSB Dwarf galaxies (Pustilnik et al. 2011b; Chengalur & Pustilnik 2013; Perepelitsyna et al. 2014) turned out very metal-deficient and/or extremely gas-rich, indicating that void environment is “conducive” for unevolved objects.
The major part of late-type dwarf galaxies located in the Lynx-Cancer and presumably in other nearby voids are LSB objects (e.g., Perepelitsyna et al. 2014, hereafter Paper IV). The latter are known to have the significant or dominant part of baryon mass in the form of cold neutral gas. To study the properties of this very important component of void galaxies, one needs to know their global Hi parameters and, first of all, their Hi mass, in order to derive their second evolutionary parameter, the gas mass-fraction fgas. Moreover, since in many void galaxies the neutral gas appears to be the main baryonic component, it is crucial to know its physical properties in order to understand galaxy dynamics and star formation. Unusual, very gas-rich and metal-poor galaxies found in course of Hi surveys, are good candidates for detailed Hi mapping. Some of studies of very metal-poor dwarfs are presented in papers of Chengalur et al. (2006), Ekta et al. (2006; 2008; 2009).
For half of the void galaxy sample (mainly for the brighter, more massive ones), the global Hi parameters were known from various published sources (mainly from Haynes et al. 2011; Springob et al. 2005; Huchtmeier & Richter 1989; Swaters et al. 2002; and Begum et al. 2008). For the remaining void galaxies, we needed to conduct our own Hi observations. Thus, the general goal of this work was to perform the most complete study of the void galaxy Hi-properties. Besides, having the first results of such study, there was a hope to find new unusual very gas-rich dwarfs among the fainter part of the void objects.
Some very interesting void low surface brightness dwarfs (LSBDs), namely very low metallicity and/or very gas-rich ones were presented in Pustilnik et al. (2010; 2011b), Chengalur & Pustilnik (2013) and Chengalur et al. (2015). As the data in Paper I show, the Lynx-Cancer void galaxies have a rather small radial velocity dispersion. This is interesting by itself in order to confront with cosmological simulations. Also this relates directly to the identification of void filaments. Since Hi velocities are in general substantially more accurate than optical ones, they provide an additional opportunity to address the issues mentioned above.
Here we present all the NRT observed galaxies with known radial velocities from the updated (relative to Paper I) void sample (Pustilnik et al. 2016, and in prep.), which currently includes 108 objects satisfying the primary selection criteria of this sample.
2. Sample
In Table A.1 we present the main parameters taken from NED1, SDSS2 or from the literature for all observed 45 void galaxies. New objects, taken from the updated Lynx-Cancer void sample (Pustilnik et al. 2016, and in prep.) are marked by an asterisk (as well as in Table A.3). Table A.1 is organized as follows: Col. 1 – short IAU-style name, Col. 2 – other name or prefix (SDSS, HIPASS, etc.), Col. 3 – galaxy type, Cols. 4 and 5 – Epoch J2000 RA and Declination, Col. 6 – heliocentric velocity from optical data (when available), Col. 7 – heliocentric velocity from Hi data, Col. 8 – total B-band magnitude. In most of the cases, this value is calculated from the total g ad r magnitudes following Lupton et al. (2005). The latter values are obtained in Paper IV on the photometry of the SDSS DR7 (Abazajian et al. 2009) images. For galaxies located outside of the SDSS footprint, the B-band magnitudes are adopted from Pustilnik & Tepliakova (2011) where respective references are given. The only exception is J0802+0525 for which its B-magnitude is estimated directly from its SDSS model g and r values since due to a nearby bright star we were unable to perform own photometry, Col. 9 – respective absolute magnitude, corrected for the Galaxy extinction AB according to Schlafly & Finkbeiner (2011). The adopted distances are based on heliocentric velocities V(Hi) from Table A.2. They are calculated according to the prescriptions given in Paper I, accounting for the large peculiar velocity in this region ΔV ~ −300 km s-1 (Tully et al. 2008). For a few objects, distances were determined using the velocity-independent (mainly Tip of RGB) methods. In Col. 10 we give a galaxy alternative name.
3. Observations and reduction
The Hi observations were made during the period 2007–2013 with the Nançay Radio Telescope (NRT). The NRT has a collecting area of 200×34.5 m and a half-power beam width (HPBW) of 3.7′ (East-West) × 22′ (North-South) at 21-cm and for a declination of δ = 0°3. A cooled 1.1−1.8 GHz dual-polarization receiver and a 8192 channel autocorrelation spectrometer were used for the observation of the Hi line. The system temperature was about 35 K and the conversion factor of the antenna temperature to the flux density for a point source was 1.5 K Jy-1 near equator. The spectrometer covered a velocity range of about 2700 km s-1, providing a channel spacing of 1.3 km s-1 before smoothing. The effective resolution after averaging of four adjacent channels and Hanning smoothing was ≈10.4 km s-1. Observations were obtained in separate cycles of “ON-source” and “OFF-source” integrations, each of 40 or 60 s in duration. “OFF” integrations were acquired at the target declination, with RA offset of ~15′× cos(δ) to the East.
A noise diode has been used to perform flux density calibration. Its power was regularly monitored through the observations of known continuum and line sources. The comparisons of our measured fluxes with independent measurements of the same objects with other telescopes indicates that flux density scales are consistent within 10%.
With the rms noise of ~1.5 to 5 mJy per resolution element after smoothing (10.4 km s-1), we achieved a S/N ratio for the peak flux densities Fpeak of the detected galaxies of 20−30 for the brightest objects, while for the faintest sources we had detections with a S/N ratio of only ~2.5−4. Total integration times per galaxy (“ON” + “OFF” + pointing time) varied between 0.6 and 6 h. For three of the forty five observed Lynx-Cancer void galaxies we obtained only upper limits of their Fpeak and of their Hi flux.
Primary data reduction has been made with the standard NRT program NAPS written by the telescope’s staff. The follow-up data processing has been done with the IRAM package CLASS. Both horizontal and vertical polarization spectra were calibrated and processed independently. They were finally averaged together. The baselines were generally well-fitted by a third order or lower polynomial and were subtracted out. Comments on the noise estimates and on several marginally detected or undetected void galaxies of 45 observed are given in the next section.
4. Results
Table A.2 presents the Hi parameters derived from the observations. This is organized as follows: Col. 1 – short IAU-style name, Col. 2 – heliocentric velocity of the detected Hi line with its 1σ error, in km s-1. This is determined as the midpoint between the half-peak points on both sides of the Hi profile; Col. 3 – the adopted distance as in Paper I (see comment for Col. 9 in Table A.1); Cols. 4 and 5 – velocity widths in km s-1 of the Hi profile at 50% and 20% of peak, W50, W20 with their 1σ errors. They are determined as the velocity range between the respective points on both sides of the Hi profile; Col. 6 – F(Hi) – integrated flux of detected Hi signal with its 1σ error in Jy km s-1. Formulae for error estimates of parameters in Cols. 2, 4−6 were adopted from our earlier NRT Hi-survey (Thuan et al. 1999) which in turn uses the prescriptions from Schneider et al. (1990); Col. 7 – logarithm of total mass M(Hi), in units of solar mass with its 1σ error; Col. 8 – ratio of M(Hi)/LB with related 1σ error, in solar units; Col. 9 – total time ON-source in minutes; Col. 10 – rms of noise near the Hi peak in mJy at the velocity resolution of 10.4 km s-1; Col. 11 – Signal-to-Noise ratio for peak value of the respective Hi profile.
Figure 1 shows in order of increasing RA the Hi profiles of the void galaxies listed respectively in Tables A.1 and A.2. For the triplet of MRK 407 (J094747.60+390503.0) only two Hi profiles are presented, which are rather complex and have been obtained with the NRT beam pointing in the direction of the largest members of the triplet. In addition, Hi profile of the galaxy J090018.30+322226.2 is not shown, since no signal have been detected. Therefore, the total number of profiles displayed is 43. We present below our comments about some peculiar objects.
SDSS J072301.42+362117.1 and J072313.46+362213.0. The first galaxy, a LSB dwarf, has been identified as a new Lynx-Cancer void galaxy after its redshift was obtained at the SAO 6 m telescope (BTA). Its NRT Hi profile suggested a possible contribution from a nearby galaxy which has been found as a very low surface brightness dwarf, ~2m fainter than the main component, at ~3′ to E (J072313.46+362213.0). An additional NRT observation in the direction allowed to partly disentangle the confusion between the Hi contributions. The final Hi parameters for these two galaxies and a third one even fainter (J072320.57+362440.8, see Table A.3) have been adopted after the subsequent GMRT Hi mapping of this triplet (Chengalur & Pustilnik 2013).
SDSS J080238.15+052551.2. This very faint and compact optical object close to a bright star was included to the void sample after its assumed identification with a faint ALFALFA source (Haynes et al. 2011) with V(Hi) = 830 km s-1, F(Hi) = 0.43 ± 0.04 Jy km s-1 with S/N ratio of 6.2 (AGC 188988). With such parameters, this galaxy has a very high ratio M(Hi)/LB ~ 4.8 (using the total SDSS g and r magnitudes, transformed to Btot = 19.8). Since very gas-rich galaxies are rare objects, we conducted Hi observations of AGC 188988 with the NRT. Our NRT data indicate no signal at the respective velocity with an upper limit of F(Hi) < 0.16 Jy km s-1 (2σ).
The probable interpretation of this case is a false ALFALFA detection. If however there exists Hi associated with the suggested faint optical object, its ratio M(Hi)/LB< 1.8 is not so large. We consider this object’s data as unreliable and excluded it from the following statistical analysis.
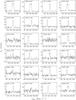 |
Fig. 1 The NRT Hi profiles Sν (in mJy) vs. Vhel (km s-1) of all studied galaxies. |
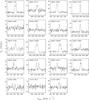 |
Fig. 1 continued. |
SDSS J090018.30+322226.2. This galaxy is a new void object with Vhel = 740 ± 30 km s-1, as measured on the faint Hα emission in the spectrum obtained at the BTA. At NRT the signal at this radial velocity is within 1.4σ, so the numbers below should be treated as upper limits. With W50 = 30 km s-1, typical of galaxies with MB ~ −12, that results in the total flux of 0.14 ± 0.10 Jy km s-1. For parameter M(Hi)/LB the respective value is 0.72 ± 0.52.
SDSS J094003.27+445931.7. This galaxy has marginally detected Hi with the radial velocity close to that derived from the SDSS emission-line spectrum (1358 ± 4 km s-1). However, there is also a similar flux detection (at the level of ~(2−3)σ) at Vhel = 1202 ± 8 km s-1. The search for a possible optical counterpart on the SDSS image to this Hi component produced two candidates within the NRT beam.
The nearest one is a small and almost edge-on blue disc SDSS J093951.28+445921.9 with g = 19.34, r = 19.15. Its BTA spectrum have revealed the velocity of Hα line of ~14 000 km s-1. The second candidate is the almost face-on LSB disc SDSS J093950.11+444800.1 with g = 17.55, r = 17.18 (B ~ 17.90), ~11.5′ to the S and 13.16 s (~140′′) to the W. Due to the NRT beam offset, its nominal Hi-flux should drop by a factor of 6.5. In this case, its ratio M(Hi)/LB is ~1.4, rather typical of void LSBDs. The optical redshift of this galaxy is needed, in order to fix the origin of the second Hi source.
MRK 407 = J094747.60+390503.0. This blue compact galaxy (BCG) is the brightest member of a triplet which includes also ~1.7-mag fainter LSBD UZC J09475+3908 at 3′ to N and ~3-mag fainter LSBD SDSS J094758.45+390510.1 at ~2′ to E. Each galaxy contributes to the F(Hi) for any NRT pointing in the direction of the triplet. We used our NRT results, accounting for the “a priori” known decrease of Hi flux for the sources NRT beam offset, as well as the earlier observations of MRK 407 by Thuan & Martin (1981) to disentangle the contribution of each component of the triplet. The typical estimated accuracy of the resulted F(Hi) is ~20%. Follow-up GMRT mapping of this triplet (Chengalur et al., in prep.) will give a better understanding of its properties.
SDSS J095633.65+271659.3 with Vhel = 1059 km s-1 is a faint companion of a ~4m brighter spiral IC 2520 (at 13.2s to W and 3.3′ to S, see Table A.3), which is also in the NRT beam and is seen in the plot of Hi profile as an additional peak at Vhel = 1243 km s-1.
SDSS J101014.96+461744.1. This is a faint galaxy with a good S/N SDSS emission-line spectrum. Its optical redshift corresponds to Vhel = 1092 ± 3 km s-1. On our data, there is no detectable Hi flux, for σnoise ~ 2.4 mJy. For statistical analysis, we adopt for its F the upper limit F(Hi) < 0.12 Jy km s-1 and the value of M(Hi)/LB< 0.34.
5. Analysis
In our analysis of the properties of the Lynx-Cancer void galaxy sample, we use the optical parameters gathered from the literature, as mentioned previously in Sect. 2, and the Hi parameters obtained from our observations or taken from the literature. Table A.3 lists galaxies with Hi data taken from the literature, with their Hi and optical parameters. Table A.3 is organized as follows: Cols. 1 to 5 – same as Table A.1; Col. 6 – adopted heliocentric velocity Vhel; Cols. 7 and 8 – the total apparent and absolute B magnitudes: for the published sample outside the SDSS zone – from Paper I, for galaxies with new photometry – from papers by Perepelitsyna et al. (2014) and for the rest of the updated version of the void sample – from Pustilnik et al. (2016, and in prep.). Few exceptions are the following. For J0706+3620 and UGC 3672, their B magnitudes are adopted from Chengalur et al. (2016). For J0736+0959, its B magnitude is adopted from the recent photometry in Haurberg et al. (2015). For J0956+2900 (DDO68C), there is no possibility to estimate its optical flux due to a nearby bright star. We adopt its B magnitude based on M(Hi) in Cannon et al. (2014) and a typical of this sample value of M(Hi)/LB = 1; Cols. 9 and 10 – total Hi flux F(Hi) and derived M(Hi); Col. 11 – reference to the Hi data. In total, we use the data of 103 void galaxies in this analysis.
In order to compare the “gas-content” parameter M(Hi)/LB of the void sample with that a sample of galaxies in denser environments, we created a sample of 82 late-type dwarf and subluminous galaxies in the Local Volume (LV) residing in groups and the Canes Venatici I (CVnI) cloud. The latter were described by Karachentsev (2005). We used those members of these groups for which we found Hi data in the literature, mainly in the Catalog of Nearby Galaxies (CNG) by Karachentsev et al. (2004).
In Fig. 2 we show (left-hand top and bottom panels, respectively) the distributions of parameter M(Hi)/LB for the void and LV-groups sample. The median value of M(Hi)/LB for the combined void and LV-group sample of 185 galaxies is equal to 1.01. Therefore galaxies with M(Hi)/LB ≥ 1.0 we call “gas-rich”. Despite each sample showing rather large scatter (indicating that there are several affecting factors), the distribution of the void galaxies is confidently shifted to the higher values of M(Hi)/LB. This effect is apparent in a factor of ~1.39 difference between their medians (1.21 and 0.87, respectively) and the significant difference in fractions of gas-rich objects in the void and LV-groups samples (0.59 and 0.41, respectively). Since these differences might be due to the statistical scatter, more advanced statistical tests are needed.
The significance of the second difference can be tested via non-parametric statistical methods. In particular, we use a test well known in biology and quality control, called “The 2 × 2 Contingency Table test” (e.g., Bol’shev & Smirnov 1983, and references therein). It appears to be more powerful than the Kolmogorov-Smirnov test in problems like this, as was tested for a similar astronomical problem in Pustilnik et al. (1995, see the detailed appendix). Here we briefly summarize the process of groupping the galaxies for the respective cells of Table 2 × 2. The zero hypothesis H0 states that the property G to be “gas-rich” does not relate to the property V to belong to the void environment, or in other words, the fraction of gas-rich galaxies is the same for both compared samples of late-type galaxies. The respective numbers in cells of Table 2 × 2 are shown in Table 1.
The 2 × 2 Contingency Table test.
Here m = 61 is the number of void gas-rich galaxies and n − m = 42 – the number of void non-gas-rich objects. M − m = 34 is the number of non-void gas-rich galaxies, while N − n − (M − m) = 48 – the number of non-void non-gas-rich ones. If properties G and V were independent, that is there were no correlation between the property to belong to void and the property to be gas-rich, the probability to get accidently the table with the same occupation numbers [61, 42, 34, 48], calculated according to the formulae in the above appendix (and Bol’shev & Smirnov 1983), is less than p = 0.012. The respective probability to reject H0 with the given occupation numbers is P = 1 − p = 0.9882. Hence, the visual impression on the significantly higher fraction of void gas-rich objects is supported with the statistical criterion at the confidence level P of 0.9882.
Apart the distributions on parameter M(Hi)/LB, we also compare in right-hand panels of Fig. 2 its relation to galaxy luminosity (via parameter MB). For aid to eye, we draw upper boundary straight lines for both samples. The visual inspection shows that for the Lynx-Cancer void galaxies this upper line goes slightly higher (by a factor of 1.6−2.0) than for “group” galaxies in the whole range of galaxy luminosities. The same is valid for the bottom boundary. With only one exception, the most gas-poor void galaxies have substantially higher values of M(Hi)/LB than the similar galaxies in groups.
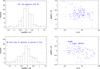 |
Fig. 2 Top left: distribution of mass-to-light ratio M(HI)/LB for all Lynx-Cancer void galaxies with Hi data. Top right: the relationship between M(HI)/LB and the absolute magnitude MB. Bottom left: distribution of M(HI)/LB for late-type dwarf and subluminous galaxies in the Local Volume (LV) groups and the CVnI cloud from Karachentsev (2005). Bottom right: the relationship between M(HI)/LB and the absolute magnitude MB for the same late-type galaxy sample. The scatter of parameter M(HI)/LB is large for all values of MB, indicating the interplay of several significant factors. Nevertheless, the fraction of higher M(HI)/LB ratio objects is clearly larger for void galaxies. Also, the three highest ratio galaxies from the LV sample are situated in the outer parts of groups and CVnI cloud (marked by their names). Median values of M(HI)/LB are respectively, 1.21 and 0.87 for void and the LV “late-type in groups” samples, which differ by a factor of ~1.39. Upper boundary line for the void sample also is a factor of 1.6−2 higher than that for the “group” sample. |
6. Discussion
In discussing noticeable differences in the gas content between void and “group” late-type galaxies, it is important to pay attention that the “group” sample is itself quite inhomogeneous, including along the classical Local Volume groups similar to our own Local Group (M 81, CenA, M 83, IC 342, Maffei, Scu) one rather rarefied and unrelaxed aggregate known as the CVnI cloud. It is curious and instructive that three of the six most gas-rich galaxies in the “group” sample (M(HI)/LB = 4.3−6.9) belong to the outer parts of this aggregate, and hence, can be treated as falling to this from the lower-density environment. These most gas-rich galaxies include DDO 154, UGCA 292 and UGC 3741 with respective values of parameter M(HI)/LB of 4.5, 6.9 and 4.3 (see the fresh summary in Chengalur & Pustilnik 2013). The structure of CVnI cloud was revisited by Makarov et al. (2013), based on the improved TRGB distance determinations.
The mentioned above extreme members of CVnI cloud reside far from the centre of the cloud, closer to the zero-velocity radius (R = 1.06 Mpc) or substantially further (at ~1.1, 0.9 and 1.6 Mpc, respectively), and thus can probably be treated as being in the process of fall-off onto CVnI cloud. Coming from the significantly lower density environment, they can posess properties of some the most unevolved representatives of underdense regions.
To check the effect of the CVnI cloud galaxies on the comparison of the LV vs. Lynx-Cancer void galaxy samples, we have removed the 11 CVnI cloud galaxies from the whole Local Volume sample. Thus, it left 71 LV galaxies. We apply the same Table 2 × 2 method as above to check the Null hypothesis H0 on the independence of gas-rich galaxy fraction on the type of environment. For the new table, the probability to get accidently the variant with occupation numbers [61, 42, 27, 44] is p = 0.00444, ~2.7 times smaller than for the whole Local Volume subsample. The respective confidence level to reject H0 is P = 1 − p = 0.99556. This probably indicates that at least a part of the CVnI cloud galaxies are in a special evolutionary status.
One important note relates to the conclusion on the difference in distributions of parameter M(HI)/LB for the void and “group” (LVG, Local Volume Groups) samples. As one can see in the right-hand panels of Fig. 2, there is a trend (known also from several earlier works, see e.g. Huchtmeier et al. 1997; Pustilnik et al. 2002): the ratio M(HI)/LB raises with the decrease of galaxy luminosity. See also Fig. 4 for the rate of this increase. Therefore, if the two samples under comparison differ significantly in MB distribution, one can obtain a noticeable difference in distribution M(HI)/LB, even though in reality these samples have the same distribution. In Fig. 3 and with related numbers we show that this is not the case. Indeed, both distributions on MB are rather similar, have close mean and median values of MB (see numbers in the figure legend), and for the “group” sample they are somewhat lower. The latter should lead in general to the opposite effect, that is the “group” sample should have more numerous gas-rich galaxies.
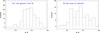 |
Fig. 3 Left: distribution of MB for 103 Lynx-Cancer void galaxies with Hi data. Right: same distribution of MB for the comparison sample 82 galaxies in groups inside the Local Volume. Median and mean values of MB of the “groups” sample (−14.10 and −14.24) are somewhat fainter than for the void sample (−14.45 and −14.61, respectively). The standard deviation in opposite is somewhat higher (2.38 mag vs. 1.83 mag). See “Discussion” for further implications. |
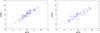 |
Fig. 4 Left: relation between M(Hi) and LB (in solar units) for 103 Lynx-Cancer void galaxies with Hi data. Dotted line shows positions for objects with M(Hi)/LB = 1. Dashed line shows the linear regression on all galaxies, with the slope of k1 = 0.875 ± 0.055 and rms = 0.45 (in log M(Hi)). Right: same relation for all 82 galaxies from comparison sample in the Local Volume groups. The slope of the linear regression is k2 = 0.792 ± 0.051 and rms = 0.44 (in log M(Hi)). See “Discussion” for further implications. |
In Fig. 4 we show how the galaxy hydrogen mass M(Hi) is related to the blue luminosity LB. The left panel is for the sample of 103 Lynx-Cancer void galaxies, while the right one is for 82 galaxies of the Local Volume group sample. Dotted lines show positions of galaxies with M(Hi)/LB = 1 (in solar units, with a slope of 1.0). The red dashed lines (see figure’s legend) show the real linear regression for considered samples. They indicate that for both samples, galaxies become on average gas-richer with decreasing luminosity. The respective coefficients in the relation log(M(Hi)/LB)/log(LB) = −0.129 ± 0.054 (void sample) and −0.208 ± 0.051 (Local Volume sample) do not differ significantly. Thus, their average ⟨k⟩ = −0.163 ± 0.040 can be considered as a representative of such relationship for both samples.
It is interesting to compare this result with estimates published for other samples. In particular, Staveley-Smith et al. (1992) found k = −0.3 ± 0.1 for a sample of LSB dIs and BCGs, while Smoker et al. (2000) found k = −0.2 ± 0.1 for emission-line galaxies of the University of Michigan survey. In the Pustilnik et al. (2002) study of BCGs in various environments, this slope for non-cluster BCGs is consistent with average of ⟨k⟩ = −0.25 ± 0.1. Thus, within rather large scatter, all available data for late-type and BCG galaxies on the relation M(Hi)/ are consistent with the common index k ~ −0.2. This corresponds to the increase of M(Hi)/LB by factor of ~4 for luminosity decrease by a factor of 1000.
This relation is a specific illustration of the well known “down-sizing phenomenon” which is connected to the slower evolution of smaller mass galaxies. The general trend towards lower gas metallicity for smaller galaxies is a better known manifestation of the same phenomenon.
6.1. Summary
-
1.
The NRT Hi data are presented for 45 galaxies of the Lynx-Cancer void. Along with Hi data already published in the literature, we could build a large sample of 103 galaxies and study the properties of ~95% of the updated Lynx-Cancer void galaxy sample.
-
2.
The analysis of parameter M(Hi)/LB – observational proxy of the relative gas content – for the void galaxy sample revealed a significant excess (at the confidence level P = 0.988) of gas-rich objects in the void sample with respect to similar late-type galaxies residing in the Local Volume (LV) groups and in the CVnI cloud. For the LV group objects which do not belong to the CnVI cloud, the difference is significant at the confidence level of 0.9956.
-
3.
The latter result can be treated as an independent evidence for slower evolution of typical void galaxies. This is consistent with similar conclusions previously published by the authors, based on the analysis of gas-phase metallicity in void galaxies and similar galaxies in denser environments.
-
4.
The ratio M(Hi)/LB for the void galaxies has a broad distribution with extreme values of ~0.05 and ~28, indicating that various competing factors can define the galaxy evolution in voids. The median value of M(Hi)/LB varies with MB within a factor of ~4 (from ~0.5 to ~2) for a luminosity range of ~3 orders of magnitude.
Sloan Digital Sky Survey (Abazajian et al. 2009, and references therein).
Acknowledgments
We thank the NRT Program Committee for allocating time for this project during years 2007−2012. The authors appreciate the anonymous referee’s report which allowed to improve the quality of the paper. The work of S.A.P. was partly supported by RFBR grants Nos. 11-02-00261 and 14-02-00520. S.A.P. appreciates the hospitality and support from Paris Observatory and its laboratory GEPI during his visits for this project. We thank J. Chengalur for permission to use Hi-fluxes for UGC 3672 system components prior publication. The Nançay Radio Observatory is the Unite scientifique de Nançay of the Observatoire de Paris, associated as Unite de Service et de Recherche (USR) No. B704 to the French Centre National de la Recherche (CNRS). The Nançay Observatory also gratefully acknowledges the financial support of the Conseil Regional de la Region Centre in France. This research has made use of the NASA/IPAC Extragalactic Database (NED) which is operated by the Jet Propulsion Laboratory, California Institute of Technology, under contract with the National Aeronautics and Space Administration. We acknowledge the usage of the HyperLeda database (http://leda.univ-lyon1.fr, Paturel et al. 2003).
References
- Abazajian, K. N., Adelman-McCarthy, J. K., Agüeros, M. A., et al. 2009, ApJS, 182, 543 [NASA ADS] [CrossRef] [Google Scholar]
- Babul, A., & Rees, M. J. 1992, MNRAS, 255, 346 [NASA ADS] [CrossRef] [Google Scholar]
- Bardeen, J. M., Bond, J. M., Kaiser, N., & Szalay, A. S. 1986, ApJ, 304, 15 [NASA ADS] [CrossRef] [Google Scholar]
- Begum, A., Chengalur, J. N., Karachentsev, I. D., Sharina, M. E., & Kaisin, S. S. 2008, MNRAS, 386, 1667 [NASA ADS] [CrossRef] [Google Scholar]
- Beygu, B., Kreckel, K., van de Weygaert, R., van der Hulst, J. M., & van Gorkom, J. H. 2012, AJ, 145, 120 [NASA ADS] [CrossRef] [Google Scholar]
- Bol’shev, L. N., & Smirnov, N. V. 1983, Tables of Mathematical Statistics (Moscow: Nauka Publishers) [Google Scholar]
- Boselli, A., Voyer, E., Boissier, S., et al. 2014, A&A, 570, A69 [NASA ADS] [CrossRef] [EDP Sciences] [Google Scholar]
- Cannon, J. M., Johnson, M., McQuinn, K., et al. 2014, ApJ, 787, L1 [NASA ADS] [CrossRef] [Google Scholar]
- Chengalur, J. N., & Pustilnik, S. A. 2013, MNRAS, 428, 1579 [NASA ADS] [CrossRef] [Google Scholar]
- Chengalur, J. N., Pustilnik, S. A., Martin, J.-M., & Kniazev, A. Y. 2006, MNRAS, 371, 1849 [NASA ADS] [CrossRef] [Google Scholar]
- Chengalur, J. N., Pustilnik, S. A., Makarov, D. I., et al. 2015, MNRAS, 448, 1643 (Paper V) [NASA ADS] [CrossRef] [Google Scholar]
- Chengalur, J. N., Pustilnik, S. A., & Egorova, E. S. 2016, MNRAS, in press [Google Scholar]
- Dekel, A., & Silk, J. 1986, ApJ, 303, 39 [NASA ADS] [CrossRef] [Google Scholar]
- Einasto, J., Suhhonenko, I., Hutsi, G., et al. 2011, A&A, 534, A128 [NASA ADS] [CrossRef] [EDP Sciences] [Google Scholar]
- Ekta, C., Jayaram, N., & Pustilnik, S. A. 2006, MNRAS, 372, 853 [NASA ADS] [CrossRef] [Google Scholar]
- Ekta, C., Jayaram, N., & Pustilnik, S. A. 2008, MNRAS, 391, 881 [NASA ADS] [CrossRef] [Google Scholar]
- Ekta, B., Pustilnik, S. A., & Chengalur, J. N. 2009, MNRAS, 397, 963 [NASA ADS] [CrossRef] [Google Scholar]
- Haurberg, N. C., Salzer, J. J., Cannon, J. M., & Marshall, M. V. 2015, ApJ, 800, 121 [NASA ADS] [CrossRef] [Google Scholar]
- Haynes, M., Giovanelli, R., Martin, A. M., et al. 2011, AJ, 142, 170 [NASA ADS] [CrossRef] [Google Scholar]
- Hirschauer, A. S., Salzer, J. J., Skillman, E. D., et al. 2016, ApJ, 822, 108 [NASA ADS] [CrossRef] [Google Scholar]
- Hoyle, F., Rojas, R. R., Vogeley, M. S., & Brinkmann, J. 2005, ApJ, 620, 618 [NASA ADS] [CrossRef] [Google Scholar]
- Hoyle, F., Vogeley, M. S., & Pan, D. 2012, MNRAS, 426, 3041 [NASA ADS] [CrossRef] [Google Scholar]
- Huchtmeier, W. K., & Richter, O.-G., A General Catalog of HI Observations of Galaxies (New York: Springer-Verlag) [Google Scholar]
- Huchtmeier, W. K., Hopp, U., & Kuhn, B. 1997, A&A, 319, 67 [NASA ADS] [Google Scholar]
- Karachentsev, I. D. 2005, AJ, 129, 178 [NASA ADS] [CrossRef] [Google Scholar]
- Karachentsev, I. D., Karachentseva, V. E., & Huchtmeier, W. K. 2001, A&A, 366, 428 [NASA ADS] [CrossRef] [EDP Sciences] [Google Scholar]
- Karachentsev, I. D., Karachentseva, V. E., Huchtmeier, W. K., & Makarov, D. I. 2004, AJ, 127, 2031 [Google Scholar]
- Kreckel, K., Joung, M. R., & Cen, R. 2011, ApJ, 735, 132 [NASA ADS] [CrossRef] [Google Scholar]
- Kreckel, K., Platen, E., Aragon-Calvo, M. A., et al. 2012, AJ, 144, 16 [NASA ADS] [CrossRef] [Google Scholar]
- Lupton R., et al. 2005, http://www.sdss.org/dr5/algorithms/sdssUBVRITransform.html#Lupton2005 [Google Scholar]
- Makarov, D. I., Makarova, L. N., & Uklein, R. I. 2013, Astrophys. Bull., 68, 125 [Google Scholar]
- Matthews, L. D., & Uson, J. M. 2008, AJ, 135, 291 [NASA ADS] [CrossRef] [Google Scholar]
- Matthews, L. D., & van Driel, W. 2000, A&AS, 143, 421 [NASA ADS] [CrossRef] [EDP Sciences] [Google Scholar]
- O’Neil, K. 2004, AJ, 128, 208 [Google Scholar]
- Patiri, S. G., Prada, F., Holtzman, J., Klypin, A., & Betancort-Rijo, J. 2006, MNRAS, 372, 1710 [NASA ADS] [CrossRef] [Google Scholar]
- Paturel, G., Petit, C., Prugniel, P., et al. 2003, A&A, 412, 45 [NASA ADS] [CrossRef] [EDP Sciences] [Google Scholar]
- Perepelitsyna, Y. A., Pustilnik, S. A., & Kniazev, A. Y. 2014, Astrophys. Bull., 69, 247 (Paper IV) [NASA ADS] [CrossRef] [Google Scholar]
- Popping, A., & Braun, R. 2011, A&A, 528, A28 [NASA ADS] [CrossRef] [EDP Sciences] [Google Scholar]
- Pustilnik, S. A., & Martin, J.-M. 2007, A&A, 464, 859 [NASA ADS] [CrossRef] [EDP Sciences] [Google Scholar]
- Pustilnik, S. A., & Tepliakova, A. L. 2011, MNRAS, 414, 1188 (Paper I) [NASA ADS] [CrossRef] [Google Scholar]
- Pustilnik, S. A., Ugryumov, A. V., Lipovetsky, V. A., Thuan, T. X., & Guseva, N. G. 1995, ApJ, 443, 499 [NASA ADS] [CrossRef] [Google Scholar]
- Pustilnik, S. A., Martin, J.-M., Huchtmeier, W., et al. 2002, A&A, 389, 405 [NASA ADS] [CrossRef] [EDP Sciences] [Google Scholar]
- Pustilnik, S. A., Tepliakova, A. L., Kniazev, A. Y., & Burenkov, A. N. 2010, MNRAS, 401, 333 [NASA ADS] [CrossRef] [Google Scholar]
- Pustilnik, S. A., Tepliakova, A. L., & Kniazev, A. Y. 2011a, Astrophys. Bull., 66, 255 (Paper II) [NASA ADS] [CrossRef] [Google Scholar]
- Pustilnik, S. A., Martin, J.-M., Tepliakova, A. L., & Kniazev, A. Y. 2011b, MNRAS, 417, 1335 (Paper III) [NASA ADS] [CrossRef] [Google Scholar]
- Pustilnik, S. A., Perepelitsyna, Y. A., & Kniazev, A. Y., 2016, MNRAS, 463, 670 (Paper VII) [NASA ADS] [CrossRef] [Google Scholar]
- Rojas, R. R., Vogeley, M. S., Hoyle, F., & Brinkmann, J. 2004, ApJ, 617, 50 [NASA ADS] [CrossRef] [Google Scholar]
- Rojas, R. R., Vogeley, M. S., Hoyle, F., & Brinkmann, J. 2005, ApJ, 624, 571 [NASA ADS] [CrossRef] [Google Scholar]
- Schlafly, E. F., & Finkbeiner, D. P. 2011, ApJ, 737, 103 [NASA ADS] [CrossRef] [Google Scholar]
- Schneider, S. E., Thuan, T. X., Magri, C., & Wadiak, J. E. 1990, ApJS, 72, 245 [NASA ADS] [CrossRef] [Google Scholar]
- Schneider, S. E., Thuan, T. X., Mangum, J. G., & Miller, J. 1992, ApJS, 81, 5 [NASA ADS] [CrossRef] [Google Scholar]
- Smoker, J. V., Davies, R. D., Axon, D. J., & Hummel, E. 2000, A&A, 361, 19 [NASA ADS] [Google Scholar]
- Sorrentino, G., Antonuccio-Delogu, V., & Rifatto, A. 2006, A&A, 460, 673 [NASA ADS] [CrossRef] [EDP Sciences] [Google Scholar]
- Springob, C. M., Haynes, M. P., Giovanelli, R., & Kent, B. R. 2005, ApJS, 160, 149 [Google Scholar]
- Staveley-Smith, L., Davies, R. D., & Kinman, T. D. 1992, MNRAS, 258, 334 [NASA ADS] [CrossRef] [Google Scholar]
- Swaters, R. A., van Albada, T. S., van der Hulst, J. M., & Sancisi, R. 2002, A&A, 390, 863 [NASA ADS] [CrossRef] [EDP Sciences] [Google Scholar]
- Thuan, T. X., & Martin, G. E. 1981, ApJ, 247, 823 [NASA ADS] [CrossRef] [Google Scholar]
- Thuan, T. X., Lipovetsky, V. A., Martin, J.-M., & Pustilnik, S. A. 1999, A&AS, 130, 100 [Google Scholar]
- Tully, R. B., Shaya, E. J., Karachentsev, I. D., et al. 2008, ApJ, 676, 184 [NASA ADS] [CrossRef] [Google Scholar]
Appendix A: Additional tables
Parameters of the Lynx-Cancer void sample galaxies observed with NRT.
Hi parameters of the observed Lynx-Cancer void sample galaxies.
Lynx-Cancer void sample galaxies with Hi data from literature.
All Tables
All Figures
|
Fig. 1 The NRT Hi profiles Sν (in mJy) vs. Vhel (km s-1) of all studied galaxies. |
| In the text | |
|
Fig. 1 continued. |
| In the text | |
|
Fig. 2 Top left: distribution of mass-to-light ratio M(HI)/LB for all Lynx-Cancer void galaxies with Hi data. Top right: the relationship between M(HI)/LB and the absolute magnitude MB. Bottom left: distribution of M(HI)/LB for late-type dwarf and subluminous galaxies in the Local Volume (LV) groups and the CVnI cloud from Karachentsev (2005). Bottom right: the relationship between M(HI)/LB and the absolute magnitude MB for the same late-type galaxy sample. The scatter of parameter M(HI)/LB is large for all values of MB, indicating the interplay of several significant factors. Nevertheless, the fraction of higher M(HI)/LB ratio objects is clearly larger for void galaxies. Also, the three highest ratio galaxies from the LV sample are situated in the outer parts of groups and CVnI cloud (marked by their names). Median values of M(HI)/LB are respectively, 1.21 and 0.87 for void and the LV “late-type in groups” samples, which differ by a factor of ~1.39. Upper boundary line for the void sample also is a factor of 1.6−2 higher than that for the “group” sample. |
| In the text | |
|
Fig. 3 Left: distribution of MB for 103 Lynx-Cancer void galaxies with Hi data. Right: same distribution of MB for the comparison sample 82 galaxies in groups inside the Local Volume. Median and mean values of MB of the “groups” sample (−14.10 and −14.24) are somewhat fainter than for the void sample (−14.45 and −14.61, respectively). The standard deviation in opposite is somewhat higher (2.38 mag vs. 1.83 mag). See “Discussion” for further implications. |
| In the text | |
|
Fig. 4 Left: relation between M(Hi) and LB (in solar units) for 103 Lynx-Cancer void galaxies with Hi data. Dotted line shows positions for objects with M(Hi)/LB = 1. Dashed line shows the linear regression on all galaxies, with the slope of k1 = 0.875 ± 0.055 and rms = 0.45 (in log M(Hi)). Right: same relation for all 82 galaxies from comparison sample in the Local Volume groups. The slope of the linear regression is k2 = 0.792 ± 0.051 and rms = 0.44 (in log M(Hi)). See “Discussion” for further implications. |
| In the text | |
Current usage metrics show cumulative count of Article Views (full-text article views including HTML views, PDF and ePub downloads, according to the available data) and Abstracts Views on Vision4Press platform.
Data correspond to usage on the plateform after 2015. The current usage metrics is available 48-96 hours after online publication and is updated daily on week days.
Initial download of the metrics may take a while.