Fig. 4
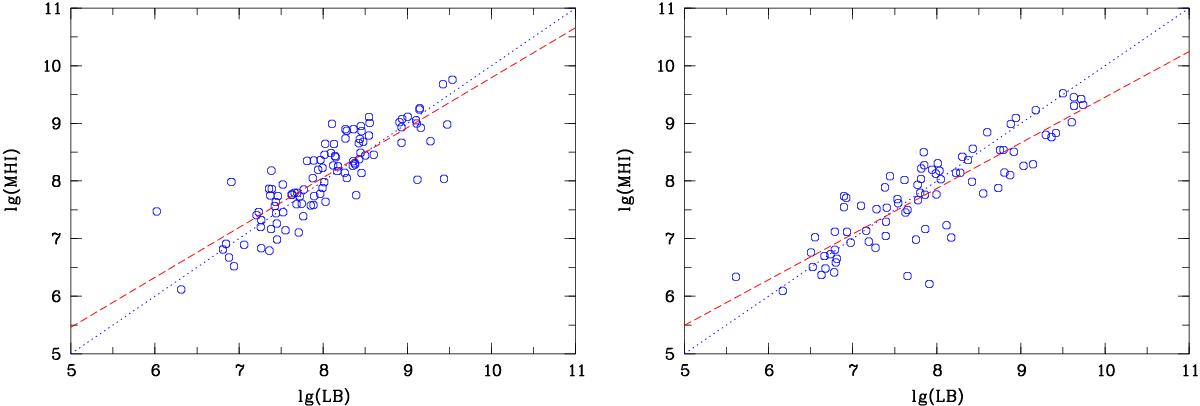
Left: relation between M(Hi) and LB (in solar units) for 103 Lynx-Cancer void galaxies with Hi data. Dotted line shows positions for objects with M(Hi)/LB = 1. Dashed line shows the linear regression on all galaxies, with the slope of k1 = 0.875 ± 0.055 and rms = 0.45 (in log M(Hi)). Right: same relation for all 82 galaxies from comparison sample in the Local Volume groups. The slope of the linear regression is k2 = 0.792 ± 0.051 and rms = 0.44 (in log M(Hi)). See “Discussion” for further implications.
Current usage metrics show cumulative count of Article Views (full-text article views including HTML views, PDF and ePub downloads, according to the available data) and Abstracts Views on Vision4Press platform.
Data correspond to usage on the plateform after 2015. The current usage metrics is available 48-96 hours after online publication and is updated daily on week days.
Initial download of the metrics may take a while.