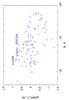
Fig. 2
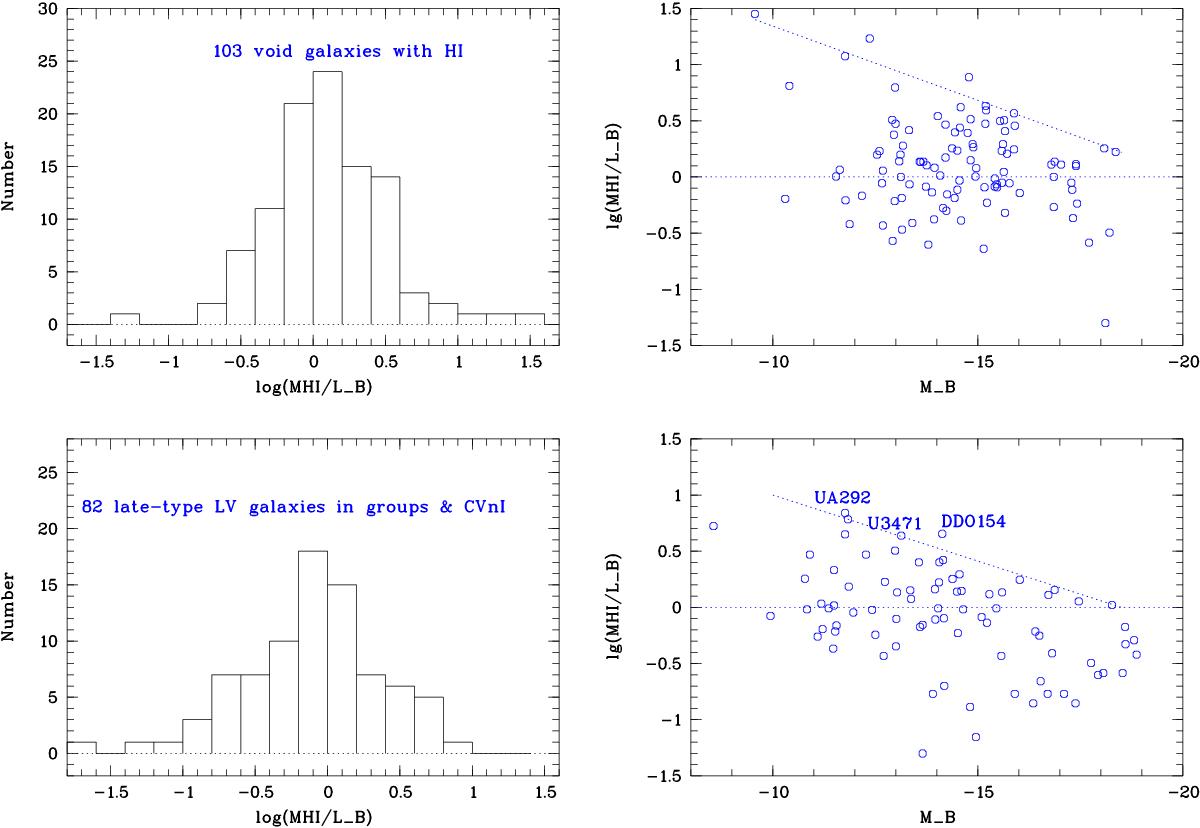
Top left: distribution of mass-to-light ratio M(HI)/LB for all Lynx-Cancer void galaxies with Hi data. Top right: the relationship between M(HI)/LB and the absolute magnitude MB. Bottom left: distribution of M(HI)/LB for late-type dwarf and subluminous galaxies in the Local Volume (LV) groups and the CVnI cloud from Karachentsev (2005). Bottom right: the relationship between M(HI)/LB and the absolute magnitude MB for the same late-type galaxy sample. The scatter of parameter M(HI)/LB is large for all values of MB, indicating the interplay of several significant factors. Nevertheless, the fraction of higher M(HI)/LB ratio objects is clearly larger for void galaxies. Also, the three highest ratio galaxies from the LV sample are situated in the outer parts of groups and CVnI cloud (marked by their names). Median values of M(HI)/LB are respectively, 1.21 and 0.87 for void and the LV “late-type in groups” samples, which differ by a factor of ~1.39. Upper boundary line for the void sample also is a factor of 1.6−2 higher than that for the “group” sample.
Current usage metrics show cumulative count of Article Views (full-text article views including HTML views, PDF and ePub downloads, according to the available data) and Abstracts Views on Vision4Press platform.
Data correspond to usage on the plateform after 2015. The current usage metrics is available 48-96 hours after online publication and is updated daily on week days.
Initial download of the metrics may take a while.