| Issue |
A&A
Volume 596, December 2016
|
|
|---|---|---|
| Article Number | C1 | |
| Number of page(s) | 3 | |
| Section | Extragalactic astronomy | |
| DOI | https://doi.org/10.1051/0004-6361/201014703e | |
| Published online | 16 December 2016 | |
The fundamental plane of EDisCS galaxies (Corrigendum)
The effect of size evolution
1 Max-Planck Institut für extraterrestrische Physik, Giessenbachstraße, 85741 Garching, Germany
e-mail: This email address is being protected from spambots. You need JavaScript enabled to view it.
2 Universitäts-Sternwarte München, Scheinerstr. 1, 81679 München, Germany
3 Departamento de Física Teórica, Universidad Autónoma de Madrid, 28049 Madrid, Spain
4 Departamento de Astrofísica, Universidad de La Laguna, 38205 La Laguna, Tenerife, Spain
5 Herzberg Institute of Astrophysics, National Research Council of Canada, Victoria, BC V9E 2E7, Canada
6 Spitzer Science Center, Caltech, Pasadena, CA 91125, USA
7 School of Physics and Astronomy, University of Nottingham, University Park, Nottingham NG7 2RD, UK
8 Dark Cosmology Centre, Niels Bohr Institute, University of Copenhagen, Juliane Maries Vej 30, 2100 Copenhagen, Denmark
9 23 rue d’Yerres, 91230 Montgeron, France
10 Laboratoire d’Astrophysique, École Polytechnique Fédérale de Lausanne (EPFL), Observatoire de Sauverny, 1290 Versoix, Switzerland
11 GEPI, Observatoire de Paris, CNRS UMR 8111, Université Paris Diderot, 92125 Meudon Cedex, France
12 Institut für Astro- und Teilchenphysik, Universität Innsbruck, Technikerstr. 25/8, 6020 Innsbruck, Austria
13 Osservatorio Astronomico, vicolo dell’Osservatorio 5, 35122 Padova Italy
14 Ohio University, Department of Physics and Astronomy, Clippinger Labs 251B, Athens, OH 45701, USA
15 INAF, Astronomical Observatory of Trieste, via Tiepolo 11, 34143 Trieste, Italy
16 Laboratoire d’Astrophysique de Toulouse-Tarbes, CNRS, Université de Toulouse, 14 Avenue Edouard Belin, 31400 Toulouse, France
17 University of Kansas, Dept. of Physics and Astronomy, Lawrence, 66045 Kensas, USA
18 Astronomy Department, University of Padova, Vicolo dell’Osservatorio 3, 35122 Padova, Italy
19 Max-Planck-Institut für Astrophysik, Karl-Schwarzschild-Str. 1, Postfach 1317, 85741 Garching, Germany
20 Steward Observatory, University of Arizona, 933 North Cherry Avenue, Tucson, AZ 85721, USA
Abstract
We discovered a mistake in Eqs. (7) and (10) of Saglia et al. (2010, A&A, 524, A6), which propagates to Tables 8 and 9 and Fig. 25. We revise the tables, the figure and the affected statements in the paper. As a result, the reduction in the luminosity evolution due to the effects of the size and velocity dispersion evolution is smaller than claimed in Saglia et al. (2010).
Key words: galaxies: elliptical and lenticular, cD / galaxies: evolution / galaxies: formation / galaxies: fundamental parameters / errata, addenda
© ESO, 2016
The paper “The fundamental plane of EDisCS galaxies. The effect of size evolution” was published in A&A, 524, A6. We discovered a mistake in Eqs. (7) and (10), the corrected version of which read: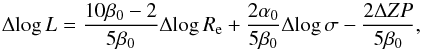 (7)and
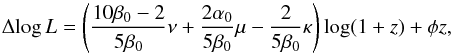 (10)while Saglia et al. (2010) had
  instead of
  of. The mistake propagates to the 6th, 7th and 8th column of Table 8, to the 4th column of Table 9 and to the triangles pointing upwards in Fig. 25. Also, in these tables and figure the value β0 = 0.3 was used, instead of the correct β0 = 0.33.
Ages derived from the evolution of the FP ZP, averaged for Mdyn < 1011M⊙ and Mdyn > 1011M⊙.
Here we provide a revised version of Tables 8, 9 and Fig. 25. As a result, the reduction in the luminosity evolution due to the effects of the size and velocity dispersion evolution is smaller than claimed in Saglia et al. (2010). The statements that need revision are the following.
In the Abstract, the statement:
For stellar masses, the luminosity evolution is reduced to LB ∝ (1 + z)1.35 for cluster galaxies and LB ∝ (1 + z)1.98 for field galaxies.
should read:
For stellar masses, the maximum reduction of the inferred luminosity evolution is by −0.38 units, from LB ∝ (1 + z)1.61 to LB ∝ (1 + z)1.23 for cluster galaxies, and from LB ∝ (1 + z)2.27 to LB ∝ (1 + z)1.89 for field galaxies.
Moreover, the final statement:
Taking into account the size and velocity dispersion evolution quoted above pushes all formation ages upwards by 1 to 4 Gyr.
should read:
Taking into account the size and velocity dispersion evolution quoted above pushes all formation ages upwards byup to 2 Gyr.
In Sect. 4.1, the statement:
Using
ν = −0.5
,
μ = + 0.1
, the change in the slope
 of the luminosity evolution
Δlog L = τlog (1 + z)
(see Eq. (
1
)) is
≈
−0.5
units.
of the luminosity evolution
Δlog L = τlog (1 + z)
(see Eq. (
1
)) is
≈
−0.5
units.
should read:
Using ν = −0.5, μ = + 0.1, the change in the slope 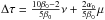 of the luminosity evolution Δlog L = τlog (1 + z) (see Eq. (1)) is ≈-0.25 units.
In Sect. 4.2, the statement:
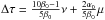
Table 9 lists the changes in the slope
should read:
Table 9 lists the changes in the slope
In the same section the statement:
obtaining Δτ = −0.39 . This implies that the luminosity evolution inferred from the ZP evolution of the EDisCS clusters without selection weighting ( L ~ (1 + z)1.61 , see Table 5) would reduce to L ~ (1 + z)1.22 .
should read:
obtaining Δτ = + 0.07. This implies that the luminosity evolution inferred from the ZP evolution of the EDisCS clusters without selection weighting (L ~ (1 + z)1.61, see Table 5) becomes L ~ (1 + z)1.68.
The final statement of the section:
... reduce the predicted luminosity evolution with redshift drastically. In contrast, by taking into account the progenitor bias (rows six to nine of Table 9), the correction Δτ to the redshift slope of the luminosity evolution inferred from the FP is far smaller.
should read:
... change the predicted luminosity evolution samewhat. The same applies by taking into account the progenitor bias (rows six to nine of Table 9).
In Sect. 4.4, the statement:
(1) minimal evolution, using Δτ = −0.7 ( M ∗ ,case 6+12, of Table 7) and φ = 0 ;
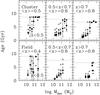 |
Fig. 25 Ages of cluster (top) and field (bottom) galaxies at low (z< 0.5, left), medium (0.5 <z< 0.7, middle), and high (z> 0.7, right) redshifts as a function of dynamical mass. The circles show the ages as derived from the bare FP zero point evolution. The filled triangles pointing upwards take into account size evolution at constant M∗, case 2+10 (see Table 9);the open triangles pointing upwards show the (wrong) values presented in Fig. 25 of Saglia et al. (2010) for comparison. The triangles pointing downwards take into account the progenitor bias of van Dokkum & Franx (2001). The median redshifts are given and the corresponding ages of the Universe are shown by the dotted lines. |
should read:
(1) minimal luminosity evolution, using Δτ =-0.38 (M∗,case 2+10, of Tables 7 and 9) and φ = 0;
Change in slope of the luminosity evolution Δlog L = τlog (1 + z) (see Eq. (7)) derived from the measured variation in the FP ZP caused by the size and velocity dispersion evolution for the different cases listed in Table 7.
Moreover, the statement:
Taking into account the size and velocity dispersion evolution considered above in the case 6+12 pushes all formation ages upwards by 1 to 4 Gyr.
should read:
Taking into account the size and velocity dispersion evolution considered above in the case M∗, 2+10 of Tables 7 and 9 pushes all formation ages upwards byup to 2 Gyr.
In the conclusions the statement:
The corrections computed at constant dynamical masses with a progenitor bias correction almost cancel out
should read:
The corrections computed at constant dynamical masseswithout a progenitor bias correction almost cancel out
The statement:
at constant stellar masses they reduce the slope of the (1 + z) dependence of luminosity by −0.6 units (case 5+11 of Table 7).
should read:
at constant stellar masses they reduce the slope of the (1 + z) dependence of luminosity by −0.38 units (case 2+10 of Table 7).
Finally, the statement:
Fitting directly the luminosity-mass relation, we derived a luminosity evolution that agrees with the one derived from the FP analysis and does not allow for large size and velocity dispersion corrections such as those derived without taking into account the progenitor bias, where a reduction of the slope of the (1 + z) dependence of luminosity by −0.8 is derived at constant M ∗ (case 1+9 of Table 7).
should read:
Fitting directly the luminosity-mass relation, we derived a luminosity evolution that agrees with the one derived from the FP analysis and does not allow for large size and velocity dispersion corrections, as indeed it is always the case.
Acknowledgments
R.P.S. thanks Alessandra Beifiori for pointing out the mistake in Eqs. (7) and (10).
All Tables
Ages derived from the evolution of the FP ZP, averaged for Mdyn < 1011M⊙ and Mdyn > 1011M⊙.
Change in slope of the luminosity evolution Δlog L = τlog (1 + z) (see Eq. (7)) derived from the measured variation in the FP ZP caused by the size and velocity dispersion evolution for the different cases listed in Table 7.
All Figures
|
Fig. 25 Ages of cluster (top) and field (bottom) galaxies at low (z< 0.5, left), medium (0.5 <z< 0.7, middle), and high (z> 0.7, right) redshifts as a function of dynamical mass. The circles show the ages as derived from the bare FP zero point evolution. The filled triangles pointing upwards take into account size evolution at constant M∗, case 2+10 (see Table 9);the open triangles pointing upwards show the (wrong) values presented in Fig. 25 of Saglia et al. (2010) for comparison. The triangles pointing downwards take into account the progenitor bias of van Dokkum & Franx (2001). The median redshifts are given and the corresponding ages of the Universe are shown by the dotted lines. |
| In the text | |
Current usage metrics show cumulative count of Article Views (full-text article views including HTML views, PDF and ePub downloads, according to the available data) and Abstracts Views on Vision4Press platform.
Data correspond to usage on the plateform after 2015. The current usage metrics is available 48-96 hours after online publication and is updated daily on week days.
Initial download of the metrics may take a while.